X-Informatics Introduction: What is Big Data, Data Analytics and X-Informatics? (Continued)
330 likes | 498 Views
X-Informatics Introduction: What is Big Data, Data Analytics and X-Informatics? (Continued). January 9 2013 Geoffrey Fox gcf@indiana.edu http:// www.infomall.org/X-InformaticsSpring2013/index.html Associate Dean for Research and Graduate Studies, School of Informatics and Computing

X-Informatics Introduction: What is Big Data, Data Analytics and X-Informatics? (Continued)
E N D
Presentation Transcript
X-Informatics Introduction:What isBig Data, Data Analytics and X-Informatics? (Continued) January 9 2013 Geoffrey Fox gcf@indiana.edu http://www.infomall.org/X-InformaticsSpring2013/index.html Associate Dean for Research and Graduate Studies, School of Informatics and Computing Indiana University Bloomington 2013
Some Terms • Data: the raw bits and bytes produced by instruments, web , e-mail, social media • Information: The cleaned up data without deep processing applied to it • Knowledge/wisdom/decisions comes from sophisticated analysis of Information • Data Analytics is the process of converting data to Information and Knowledge and then decisions or policy • Data Science describes the whole process • X-Informatics is use of Data Science to produce wisdom in field X
The Course in One Sentence Study Clouds running Data Analytics processing Big Data to solve problems in X-Informatics
Structure of Course • Based on informal survey, course will cover • Use of (Big) data in application areas (the X in X-Informatics) • Some examples will be based on “academic study” • Some examples will use online resources • Other examples will involve Python
MM = Million Ruh VP Software GE http://fisheritcenter.haas.berkeley.edu/Big_Data/index.html
Previous slide (sensors in engines) was last one Continue Big Data in Business (a statistics summary slide followed by eBay)
Trend: Analytical Software Solutions • Integrated software solutions for business problems • What are the opportunities for statisticians? http://www.hsph.harvard.edu/ncb2011/files/ncb2011-z03-rodriguez.pptx
http://fisheritcenter.haas.berkeley.edu/Big_Data/Williams.pdf
The data deluge: The Economist Feb 25 2010 http://www.economist.com/node/15579717 WHEN the Sloan Digital Sky Survey started work in 2000, its telescope in New Mexico collected more data in its first few weeks than had been amassed in the entire history of astronomy. Now, a decade later, its archive contains a whopping 140 terabytes of information. A successor, the Large Synoptic Survey Telescope, due to come on stream in Chile in 2016, will acquire that quantity of data every five days. Such astronomical amounts of information can be found closer to Earth too. Wal-Mart, a retail giant, handles more than 1m customer transactions every hour, feeding databases estimated at more than 2.5 petabytes—the equivalent of 167 times the books in America's Library of Congress (see article for an explanation of how data are quantified). Facebook, a social-networking website, is home to 40 billion photos. And decoding the human genome involves analysing 3 billion base pairs—which took ten years the first time it was done, in 2003, but can now be achieved in one week.
Why need cost effective Computing! Full Personal Genomics: 3 petabytes per day http://www.genome.gov/sequencingcosts/
Ninety-six percent of radiology practices in the USA are filmless and Table below illustrates the annual volume of data across the types of diagnostic imaging; this does not include cardiology which would take the total to over 109 GB (an Exabyte). http://grids.ucs.indiana.edu/ptliupages/publications/Where%20does%20all%20the%20data%20come%20from%20v7.pd
http://grids.ucs.indiana.edu/ptliupages/publications/Where%20does%20all%20the%20data%20come%20from%20v7.pdhttp://grids.ucs.indiana.edu/ptliupages/publications/Where%20does%20all%20the%20data%20come%20from%20v7.pd This analysis raw data reconstructed data AOD and TAGS Physics is performed on the multi-tier LHC Computing Grid. Note that every event can be analyzed independently so that many events can be processed in parallel with some concentration operations such as those to gather entries in a histogram. This implies that both Grid and Cloud solutions work with this type of data with currently Grids being the only implementation today. ATLAS Expt Note LHC lies in a tunnel 27 kilometres (17 mi) in circumference Higgs Event The LHC produces some 15 petabytes of data per year of all varieties and with the exact value depending on duty factor of accelerator (which is reduced simply to cut electricity cost but also due to malfunction of one or more of the many complex systems) and experiments. The raw data produced by experiments is processed on the LHC Computing Grid, which has some 200,000 Cores arranged in a three level structure. Tier-0 is CERN itself, Tier 1 are national facilities and Tier 2 are regional systems. For example one LHC experiment (CMS) has 7 Tier-1 and 50 Tier-2 facilities.
http://www.quantumdiaries.org/2012/09/07/why-particle-detectors-need-a-trigger/atlasmgg/http://www.quantumdiaries.org/2012/09/07/why-particle-detectors-need-a-trigger/atlasmgg/ Model
Personal Note • As a naïve undergraduate in 1964, I was told by Professor that bumps like • Were particles. I was amazed and found this more intriguing than anything else I had heard about so I decided to do PhD in area. • Note errors; measurements have errors that are SQRT(N) ( N~2000 measured # of events) • Central Limit theorem that dominates design and study of all such event-based experiments • Note methodology is use of histograms and I used to write (Fortran) code to do all this processing – See routine Papoose at http://salsahpc.indiana.edu/dlib/articles/00001935/ from 1978 • Run on CDC 7600 – the supercomputer from that time accessed over over “Internet” • Note perforated paper. Program on cards discarded
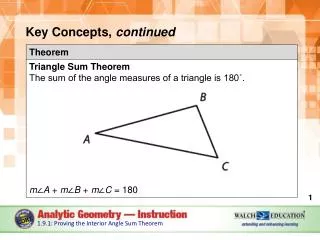
Models and Theory • Newton’s laws such Mass . Acceleration = Force is a theory as is Einstein’s special relativity and gravitational (general relativity) theory • Physicists just discovered a new particle – the Higgs or God particle whose existence was predicted by the “Grand Unified Theory” • Its search was handicapped as theory did not predict mass and a model is needed to calculate this (I used to build such models) • A model is a hopefully theoretically motivated “phenomenological” approach that allows predictions. Models often have parameters that are fit to existing data to predict new data (see FFF paper) http://en.wikipedia.org/wiki/Simple_linear_regression: Okun's law in macroeconomics is an example of the simple linear regression. Here the dependent variable (GDP growth) is presumed to be in a linear relationship with the changes in the unemployment rate.
2005-20011 Job request at European Bioinformatics Institute EBI for Web hits and automated services WS http://www.ebi.ac.uk/Information/Brochures/
2005-20011 Data stored at European Bioinformatics Institute EBI http://www.ebi.ac.uk/Information/Brochures/
The 4 paradigms of Scientific Research • Theory • Experiment or Observation • E.g. Newton observed apples falling to design his theory of mechanics • Simulation of theory or model • Data-driven (Big Data) or The Fourth Paradigm: Data-Intensive Scientific Discovery (aka Data Science) • http://research.microsoft.com/en-us/collaboration/fourthparadigm/ • A free book • More data; less models
Another Personal Note • In 1990, only methods 1 and 2 were recognized but due to increasing power of computers, method 3 (computation science) was being recognized • I tried to persuade Caltech to adopt a “computational science curriculum” but failed • I left Caltech partly for this reason • I now realize that perhaps not such a good idea as not huge numbers of jobs in area. • However starting in 2005-2010, method 4 and data science emerges • There are lots of jobs in data science so curricula perhaps more interesting
The Long Tail of Science High energy physics, astronomy genomics The long tail: economics, social science, …. • Collectively “long tail” science is generating a lot of data • Estimated at over 1PB per year and it is growing fast. 80-20 rule: 20% users generate 80% data but not necessarily 80% knowledge Gannon Talk
Internet of Things and the Cloud • It is projected that there will be 24 billion devices on the Internet by 2020. Most will be small sensors that send streams of information into the cloud where it will be processed and integrated with other streams and turned into knowledge that will help our lives in a multitude of small and big ways. • Thecloud will become increasing important as a controller of and resource provider for the Internet of Things. • As well as today’s use for smart phone and gaming console support, “Intelligent River” “smart homes and grid” and “ubiquitous cities” build on this vision and we could expect a growth in cloud supported/controlled robotics. • Some of these “things” will be supporting science • Natural parallelism over “things” • “Things” are distributed and so form a Grid
Sensors (Things) as a Service Output Sensor Sensors as a Service Sensor Processing as a Service (could useMapReduce) A larger sensor ……… https://sites.google.com/site/opensourceiotcloud/ Open Source Sensor (IoT) Cloud