Download

1 / 9
90 likes | 187 Views
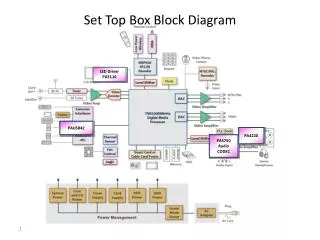
OUTLINE SCM block diagram : a brief reminder Preamplifier (PA) specifications versus EM measurement Sensor (SC) specifications versus EM measurement. PA & Sensor ICD Conclusion. 1 ) SCM block diagram : A brief reminder Sketch of single preamplifier & sensor Two stages of amplification :

E N D
OUTLINE • SCM block diagram : a brief reminder • Preamplifier (PA) specifications versus EM measurement • Sensor (SC) specifications versus EM measurement. • PA & Sensor ICD • Conclusion
1) SCM block diagram : A brief reminder • Sketch of single preamplifier & sensor • Two stages of amplification : • 1st stage : low noise preamplifier • 2nd stage : filtering & amplification • b) View of preamplifier for tri axis SCM • 1 PA/Sensor • 1 Voltage supply regulator • 1 Calibration function
2) Preamplifier (PA) specifications versus EM PA measurement (at cube level) • Tests conditions : Tamb=25°C ; V+=7,6V ; V-=-6,6V • Preamplifier of SCM with 3 PA cubes inside is under assembly. • N.B. : EM4 is a spare cube.
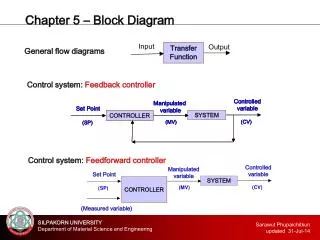
Typical transfer function of PreamplifierMeasurement is compliant with specifications.Temperature dependency is small.Ongoing tests will concern whole PA (Preamplifier +Calibration function).
3) Sensor (SC) specifications versus EM measurement. • Measurement at each step of manufacturing. Table below shows measurement at last step (after magnetic core potting) EM measurement results close to Design for relevant parameters : Resistance and slope (obtain from numerical simulation).Relevant parameters for EM are closed (<5%).
Typical transfer function for EM Sensor(SCEM2 is presented) : • Slope is measured at low frequency. • Resonance frequency will be flattened by flux feedback.
4) Preamplifier & sensor ICD Preamplifier ICD : Output (differential) : analog signals +/-5V (maximal values +7,6V/-6,6V). Gain : 1V/nT (in flat bandwidth at -3dB [55Hz to 4kHz]). Voltage supplies lines : +10V, -10V, and AGND (0V) Maximal current on both+/-10V : 4 mA One digital signal SCM_CAL used to control the SCM calibration
SCM orientation ICD. • Convention : « When Sensor is aligned with magnetic field (wires on extremity arrow), phase between voltage output of preamplifier and magnetic field in the flat part of the bandwidth is close to 0°. » • Magnetic axis will be calibrated (accuracy 0,2°) at “Chambon la Forêt”.
5) Conclusion • No major change on electrical design have been reported : • Only 1 Calibration command is used • Performances meet requirements : • Sensitivity for EM will fit sensitivity scientific requirements : • 0,85pT/sqrt(Hz) at 10Hz. • 20fT/sqrt(Hz) at 1kHz. • Power consumption at cube level is compliant with requirement. Validation on whole preamplifier might be compliant (expected <80mW). • Transfer function, sensitivity, power consumption and magnetic axis will be checked during complete calibration of SCM.