Download
1 / 13
130 likes | 194 Views
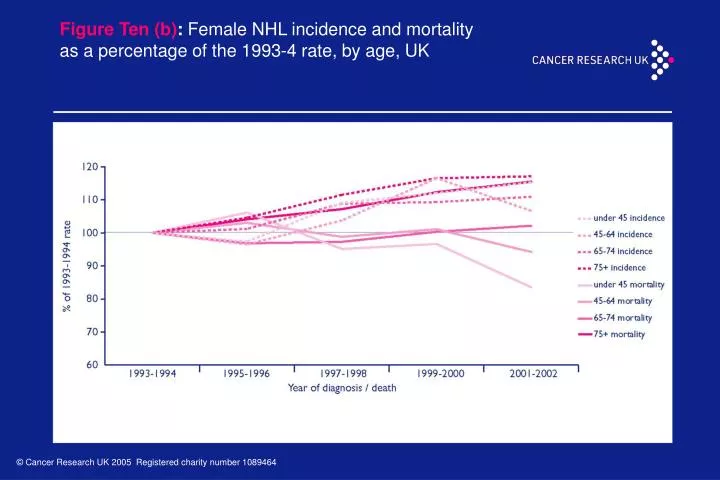
Figure Ten (b) : Female NHL incidence and mortality as a percentage of the 1993-4 rate, by age, UK. Figure Eleven (a) : Male oesophageal cancer incidence and mortality as a percentage of 1993-4 rate, by age, UK.

E N D
Figure Ten (b):Female NHL incidence and mortality as a percentage of the 1993-4 rate, by age, UK
Figure Eleven (a):Male oesophageal cancer incidence and mortality as a percentage of 1993-4 rate, by age, UK
Figure Eleven (b):Female oesophageal cancer incidence and mortality as a percentage of 1993-4 rate, by age, UK
Figure Twelve:Ovarian cancer incidence and mortality as a percentage of the 1993-4 rate, by age, UK
Figure Thirteen:Uterine cancer incidence and mortality as a percentage of 1993-4 rate, by age, UK
Figure Fourteen (a):Male malignant melanoma incidence and mortality as a percentage of the 1993-4 rate, by age, UK
Figure Fourteen (b):Female malignant melanoma incidence and mortality as a percentage of the 1993-4 rate, by age, UK
Figure Fifteen (a):Male kidney cancer incidence and mortality as a percentage of 1993-4 rate, by age, UK
Figure Fifteen (b):Female kidney cancer incidence and mortality as a percentage of 1993-4 rate, by age, UK
Figure Sixteen (a):Male oral cancer incidence and mortality as a percentage of 1993-4 rate, by age, UK
Figure Sixteen (b):Female oral cancer incidence and mortality as a percentage of the 1993-4 rate, by age, UK
Figure Seventeen:Cervical cancer incidence and mortality as a percentage of the 1993-4 rate, by age, UK
Figure Eighteen:Testicular cancer incidence and mortality as a percentage of the 1993-4 rate, by age, UK 1993-2002