Download
1 / 5
50 likes | 161 Views
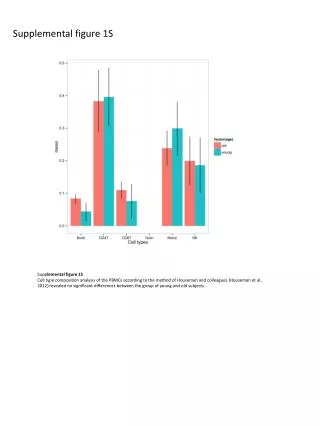
This study focuses on the intricate dynamics of enhancer and silencer elements in the differentiation of erythroid-myeloid cells. Using MNase and DNase I treatments, we analyze the chromatin accessibility and regulatory features of naked DNA in various cell types, including DT40 lymphoid and pre-erythroblasts. Our findings, displayed through a series of figures, contribute to the understanding of gene regulation during cell differentiation, emphasizing the role of specific enhancers and silencers in hematopoiesis.

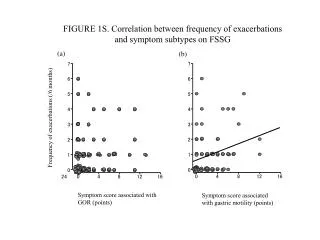
E N D
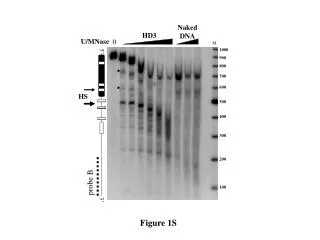
Naked DNA HD3 U/MNase 0 M 5’ 1000 * 900 800 * 700 HS 600 500 400 300 200 probe B 3’ 100 Figure 1S
10d-RBC TD-RBC naked DT40 HD24 6C2 HD3 0 0 0 0 0 U/MNase M 5’ 1000 900 800 700 HS 600 * * * * 500 * * * * 400 300 probe B 200 3´ D i f e r e n t i a t i o n Figure 2S
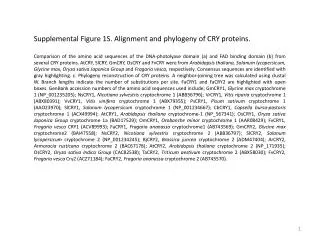
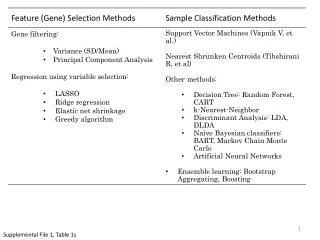
silencer enhancer/120 bp 100 bp DT40 lymphoid 5’ 3’ HD24 erythroid-myeloid 6C2 pre-erythroblast A B HD3 erythroblast 10d-RBC erythrocytes Figure 3S
A B RMCE-HD3-13 RMCE-HD3-14 RMCE-HD3-13 RMCE-HD3-14 aDE120 aDE120 aDE120 aDE120 HD3 Events Events Events Events Events FL1-H:GFP FL1-H:GFP FL1-H:GFP FL1-H:GFP FL1-H:GFP * ** * ** * ** * ** MNase DNaseI MNase DNaseI MNase DNaseI MNase DNaseI 5’ 3’ HS HS f1-ori GFP 3’ 5’ Figure 4S
RMCE-HD3-13 RMCE-HD3-14 RMCE-HD3-20 aDSE120 D1 aDSE120 D1 aDSE120 D1 HD3 Events Events Events Events FL1-H:GFP FL1-H:GFP FL1-H:GFP FL1-H:GFP * ** * ** * ** MNase DNaseI MNase DNaseI MNase DNaseI 3’ HS GFP 5’ Figure 5S