Download
1 / 24
240 likes | 322 Views
Individual Differences. Low. High. 1 2 3 4 5 6 7 8 9 10 11 12 13 14 15 16 17 18 19 20. Equal Distance Quantification. Interval & Ratio. 20. 19. 10. 2. 1. Ordinal. 1st. 2nd.

E N D
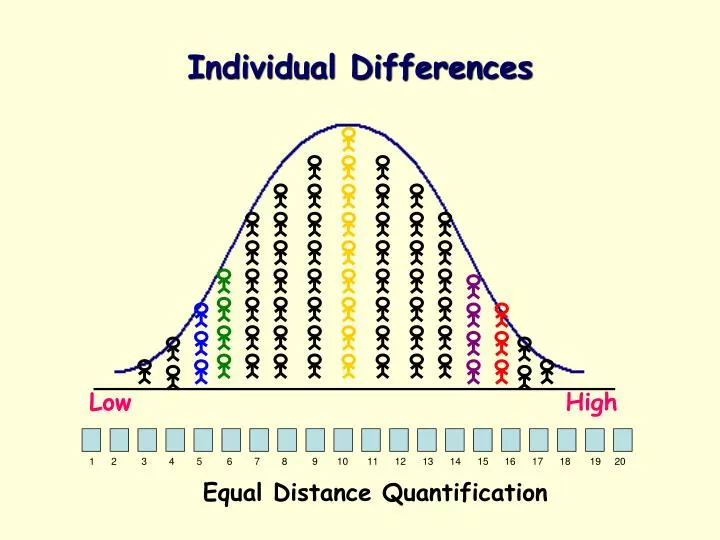
Individual Differences Low High 1 2 3 4 5 6 7 8 9 10 11 12 13 14 15 16 17 18 19 20 Equal Distance Quantification
Interval & Ratio 20 19 10 2 1
Ordinal 1st 2nd 3rd 4th 5th Nominal Winners Tops Losers Bottom
Mean Median Mode is unbiased, consistent and efficient estimateofµ Central Tendency & Skewness M Md Mode Mode Md M
Percentile is the value on a scale below which a given percentage of cases fall. 25th percentile is called lower quartile. 75th percentile is called upper quartile.
Variability (& Kurtosis) σ2 σ2 σ2 Average squared deviation from the mean Average deviation from the mean s2 is unbiased, consistent, efficient estimate of σ2
+ + + Box Plot
Stem and Leaf Plot Data Stem–and-Leaf Missing = 3
Linear Transformation & Standard Scores z-score µ = 0, σ= 1 - 4.0 -3.0 - 2.0 -1.0 0 +1.0 +2.0 +3.0 +4.0 T-score µ = 50, σ= 10 20 30 40 50 60 70 80 GRE, SAT µ = 500, σ= 100 200 300 400 500 600 700 800 Wechsler IQ µ= 100, σ= 15 55 70 85 100 115 130 145 µ= 100, σ= 16 SB IQ 52 68 84 100 116 132 148 Test of this course µ= 25, σ= 10 5 15 25 35 45
Normal Distribution .3413 .3413 .1359 .1359 .0228 .0228 -3 -2 -1 0 1 2 3
P (X > 1.64) 0.05 0 1.64
Area between -1 and -2 .1359 .1359 -3 -2 -1 0 1 2 3
= 35, s = 5, % above 40 .1587 -3 -2 -1 0 1 2 3 20 25 30 35 40 45 50
= 35, s = 5, % above 30 .8413 -3 -2 -1 0 1 2 3 20 25 30 35 40 45 50
= 35, s = 5, % below 25 .0228 -3 -2 -1 0 1 2 3 20 25 30 35 40 45 50
= 35, s = 5, % between 25 and 30 .1587 – 0.0228 -3 -2 -1 0 1 2 3 20 25 30 35 40 45 50
= 35, s = 5, 95th percentile 1.64 -3 -2 -1 0 1 2 3 43.2 20 25 30 35 40 45 50
= 35, s = 5, 75th percentile .67 -3 -2 -1 0 1 2 3 38.35 20 25 30 35 40 45 50
CI 90 -3 -2 -1 0 1 2 3 1.64 -1.64
CI 95 -3 -2 -1 0 1 2 3 -1.96 1.96