Download
1 / 30
300 likes | 444 Views
London School of Economics 14 September 2010. Health System Decentralization in Spain. Dr. Antonio Durán. Main topics to be addressed - Division of competencies, Political reasons behind devolution, How it works in practice; Results. Spain, some data 2010.

E N D
London School of Economics 14 September 2010 Health System Decentralization in Spain Dr. Antonio Durán
Main topics to be addressed • - Division of competencies, • Political reasons behind devolution, • How it works in practice; • Results
Spain, some data 2010 Total population 46,157,822 Foreign population 5.268.762 (non UE 60.1%) Fertility rate 1.46 children per woman Literacy rate 97.8% GDP (2010 est.) 1,422.1 US$ billions GDP per capita (2010 est.) 30,565 US $ at PPP Recorded unemployment 19.8 (2010 est.) National Institute of Statistics. http://www.ine.es Consulted May, 2010; The Economist Intelligence Unit, March 2010, Spain Country Report p.17http://www.eiu.com
High in the world “health rankings” • 4th in life expectancy at birth (3rd for females); • 4th in life expectancy at age 65; • 4th in female potential years of life lost; • Under average in EU infant mortality (sixth in average annual rate of decline since the 1970); • Mortality for top causes since 1970 in Europe (CV diseases, cancer and respiratory diseases) among the lowest and in steady decrease.
Summary health indicators 1970-2008 (selected years) Source: European Health for All Database, May, 2010 (*) Instituto Nacional de Esadística, May 2010
1991–2005 reductions in avoidable mortality suggest substantive access, quality and safety INEBASE: Social Indicators 2006. INE, June 2008. [Primary prevention sensitive conditions include: lung cancer, hepatic cirrhosis and motor-vehicle accidents. Medical care sensitive conditions include: respiratory, circulatory and cancer. 1 per 10.000 deaths. 2 Adjusted rates per 1 000 inhabitants. 3 Relative reduction]
Selected cancers. Five-year relative survival rates Source: KantarHealth (2010) Oncology Market Access. Europe. Data taken from the EUROCARE-4 study.
Coverage: all citizens and residents -except 0.5%, high-income non-salaried individuals; • PHC provided by publicly salaried professionals (1 doctor & nurse for every 1,500 inhabitants with numerous prevention programs); • Public sector: 71.2% of available beds (40% owned) with 80% of the acute beds pool, 36% of psychiatric beds and 30% of long-term beds; • High users’ satisfaction and system legitimacy as per surveys (with specific exceptions). García S, Abadía B, Durán A and Bernal E, 2010, Spain: Health system review. Health Systems in Transition, 12 (4): 1–290
Respondents “SNS works quite well” + “works well yet needs changes” 69,2 70 68,1 67,4 68 66 % of respondents 64 61,3 62 60 58 56 1995 …. 2007 2008 2009 Years Agencia de Calidad del SNS. Instituto de Información Sanitaria, 2010, Barómetro Sanitario 2009.
Health expenditure as % of GDP, selected European countries 2008 France 11,1 10,5 Switzerland Germany 10,4 10,1 Portugal Austria 10,1 Denmark 9,9 Greece 9,7 Belgium 9,7 Sweden 9,1 Netherlands 9,1 9 United Kingdom Italy 9 Ireland 8,7 Spain 8,7 Norway 8,6 Finland 8,4 Bulgaria 7,3 7,2 Luxembourg Ukraine 6,8 6,8 Czech Republic Poland 6,6 Belarus 6,5 Russian Federation 5,2 Romania 4,7 Kazakhstan 3,7 0 2 4 6 8 10 12 Joint OCDE, WHO and EUROSTAT National Health Accounts, www.who.int/country/en, June 2010
Finland 57 95 172 320 539 855 1,291 France 75 124 215 409 736 1,083 1,528 Germany 98 135 228 484 856 1,175 1,522 Greece 16 27 61 107 192 282 400 Iceland 53 88 146 307 611 889 1,379 Ireland 37 52 102 246 477 572 748 Italy 51 83 162 296 600 814 1,296 Japan 27 64 133 269 540 792 1,119 Luxembourg - - 160 340 657 930 1,392 Netherlands 74 106 222 441 742 931 1,286 New Zealand 49 77 183 369 568 747 995 Norway 95 - 141 322 573 846 1,193 OECD, Per Capita Health Spending US$, 1960-2007 2007 1960 1965 1970 1975 1980 1985 1990 2000 3357 Australia 99 127 219 463 696 998 1,310 1,730 3763 Austria 69 94 172 389 716 984 1,383 2,277 Belgium 55 84 135 320 607 879 1,242 1,918 3595 3895 Canada 109 155 264 457 773 1,244 1,811 1,783 3512 Denmark 70 125 226 363 618 807 1,051 2,574 1,789 2840 3601 2,369 3588 2,713 2727 905 3319 2,149 1326 3424 2686 1,855 2696 2,373 5686 2,580 3837 2,041 2454 1,416 4763 2,283 2283 Portugal - - 48 166 265 398 554 845 2671 Spain 14 38 87 198 342 452 774 1,071 Sweden 94 151 285 496 897 1,150 1,455 2,456 3323 Switzerland 96 141 281 541 886 1,224 1,640 3,564 4417 651 Turkey - - - 39 67 66 133 118 2992 1303 United 80 101 155 286 474 685 985 Kingdom 7290 4,187 143 204 346 592 1,064 1,711 2,601 United States 3049,5* OECD average 1,984 70 104 180 343 604 855 1,212 *Average for 2007 includes the 6 last members (Czech Republic, Hungary, Korea, Mexico, Poland and Slovakia). Source: Schieber G, Poullier JP, Greenwald L, “US Health Expenditure Performance: International Comparison and Data Update” Health Care Financing Review 1992; “Health Spending, Delivery and Outcomes in OECD Countries,” Health Affairs 1993, WHO World Health Report 2000, OECD Health Data: Statistics and Indicators for 30 countries, (http://www.irdes.fr/EcoSante/DownLoad/OECDHealthData_FrequentlyRequestedData.xls)
2008; sources of funds & expenses % of revenue by source % of public funds spent Other 8.8% Professional mutuality schemes 2.53% Prevention & Public Health 1.4% Out-of-pocket 22.5% Civil servants mutual funds 3,4% Taxation 94,07% Pharmaceuticals 19.8% Private insurance 5.5% Specialist care 54% PHC 16% Public sector funding 71 % Source: García S, Abadía B, Durán A and Bernal E (2010) Spain: Health system review. Health Systems in Transition, 12 (4): 1–290
Health: Legal framework Article 43 of the 1978 Constitution: recognizes the right to health protection 1986 National General Health Law shifted from the 1948 Compulsory Insurance scheme to a National Health System based on: Universal service Equity in access Integration Decentralization 2003 SNS Cohesion and Quality Act shapes up the current decentralized health system
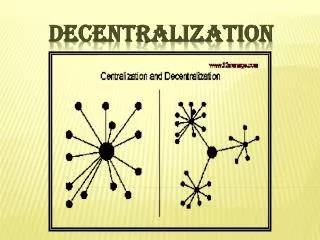
“Federal-like” system… without Federation National Government + 2-Chamber Parliament 17 Autonomous Communities 2 Autonomous Cities Parliaments elected by direct vote Regional Governments Regional Ministries of Health coordinated by the Ministry of Health and Social Policy
Regions spend 89.81% of public funds -mostly not ear-marked budgets transfers from State; central administration 3%;municipalities 1.25% (Cohesion and Quality Law. 2003) Regional governments: health authority plus health service (30% of AACCs’ total budgets).
But problems with (i) Geographical differences in health outcomes and financing (ii) Large unwarranted variability in access, quality, safety and efficiency
Life expectancy at birth, both sexes, by Autonomous Community Navarra 82,5 82,5 Madrid 82,1 Castilla y León 81,8 La Rioja Aragón 81,7 País Vasco 81,6 Cataluña 81,6 Baleares 81,6 Castilla-Mancha 81,5 Average SPAIN 81,1 81,1 Cantabria 81 Galicia 80,6 Extremadura 80,6 Com. Valenciana Murcia 80,5 Canarias 80,4 Asturias 80,4 Andalucía 79,8 Ceuta/Melilla 79,5 75 76 77 78 79 80 81 82 83 Ministerio de Sanidad y Politica Social (2009) Indicadores de salud 2009. Evolucion de los indicadores y el estado de salud en España y su magnitud en el contexto de la Union Europea, http://www.msc.es/estadEstudios/estadisticas/inforRecopilaciones/docs/Indicadores2009.pdf
Healthcare decentralization in Spain has shown no positive effect on convergence in health, as measured by LEB and IM (…) Some provinces improved their situation overtaking others but the final result is one of greater dispersion than at the start. Montero-Granados, R et al, 2007, Social Science & Medicine 64, 1253–1264, Decentralization and convergence in health among the provinces of Spain (1980–2001)
Public health care expenses per person, 2010 (budgeted) Range: 557 Euros or 40’73% around the average of 1343 Euros (Balearic Islands 79,37%, Vs Basque Country: 120,84%) Federación de Asociaciones para la Defensa de la Sanidad Pública (FADSP), In Diferencias notorias en el presupuesto per cápita entre CC.AA. http://www.medicosypacientes.com/5 Enero 2010
Public healthcare budget per capita < average national public healthcare budget of1343 Euros Public healthcare budget per capita > average national public healthcare budget of1343 Euros Public healthcare budget per capita and political sign of the Regional Government 2010 “Conservative” “Progressive” “Nationalist” Federación de Asociaciones para la Defensa de la Sanidad Pública (FADSP), 2010. En Diferencias notorias en el presupuesto per cápita entre CC.AA., según un estudio de la FADSP, Anónimo, 2010. http://www.medicosypacientes.com/5 Enero 2009
EXPEND. 2007 MURCIA CANARIAS MADRID GALICIA C. Y LEÓN ARAGÓN BALEARES ASTURIAS CANTABRIA PAÍS VASCO NAVARRA VARIATION 06-07(%) 1,212.02 1,224.19 1,282.22 1,087.51 1,176.37 1,160.11 1,093.69 1,235.03 1,471.59 1,342.27 1,339.48 3.66 11.61 9.16 16.70 4.24 14.82 14.31 4.98 24.45 19.40 15.11 EXTREMADURA C. VALENCIANA 1,349.44 1,058.68 11.92 14.07 ANDALUCÍA C. LA MANCHA LA RIOJA 1,249.31 1,224.19 1,089.25 15.60 11.61 11.34 2007 public per capita health expenditure by region TOTAL 1,170.39 11.10 Source: FADSP, Ministry of Health as per EL País, 3 January 2008
Sustainability concerns…(> 130% growth in capital expenditure in 2000–2008!) OECD Health Data (June 2009). http://www.ecosante.org (*)Data for 2008: World Health Organisation (March 2010) National Health Accounts- Country Information. Spain . http://www.who.int/nha/country/esp.pdf
Unwarranted variability in access, quality, safety and efficiency, across regions, health care areas and hospitals. 5-time variations in use of percutaneous transluminal coronary angioplasty PTCA between areas; 2-fold variation in mortality after PTCA (hospitals) 7.7-time variability in prostatectomy rates across health care areas Caesarean sections increasing unwarrantedly; variability among hospitals declining due to the convergence of all providers towards high rates. 2.2 to 4.5 times higher fatality rates by low-mortality DRGs, decubitus ulcer, catheter-related infection, pulmonary thromboembolism and deep-venous thrombosis after surgery or post-operative sepsis across health care areas. 28 times more frequent admissions to acute care hospitals due to affective psychosis among areas 26% of hospitals with more than 501 and less than 1000 beds, at least 15% more inefficient than the standard; 12% of hospitals with more than 201 beds and less than 500 were, at least, 25% less efficient than the standard for treating similar patients García S, Abadía B, Durán A and Bernal E, 2010, Spain: Health system review. Health Systems in Transition, 12 (4): 1–290
“Inequalities in health and healthcare in Spain appear to be driven by income inequalities and inequalities in service use but not by inequalities in financing and health expenditure. Region states politically responsible for the organization of healthcare did not exhibit significant differences in health and healthcare inequalities and tend to exhibit a better equity performance”. Costa-Font J and Gil J, 2009. Exploring the pathways of inequality in health, health care access and financing in decentralized Spain, Journal of European Social Policy, Vol. 19(5): 446–458
1992-2009 per capita expenditure variation coefficient among Regions (changes in population protected volume fail to explain this variability). García S, Abadía B, Durán A and Bernal E, 2010, Spain: Health system review. Health Systems in Transition, 12 (4): 1–290
Respondents who believe that same health services are offered to all citizens despite… 100,0 88,6 87,5 87,1 90,0 80,0 70,6 70,1 68,8 70,0 60,0 2007 Percentage 45,3 50,0 43,3 42,0 2008 40,0 2009 30,0 20,0 10,0 0,0 Autonomous Community ofresidence Patient's social class and wealth Patient's gender Agencia de Calidad del SNS. Instituto de Información Sanitaria, 2010, Barómetro Sanitario 2009.
Public sector staff uncertain numbers. Health care personnel/100000, 1980– 2007, selected yrs WHO/Europe, European HFA Database, Consulted May 2010 quoted inGarcía S, Abadía B, Durán A and Bernal E, 2010, Spain: Health system review. Health Systems in Transition, 12 (4): 1–290
Health Information System in Spain. In spite of very serious financial investments… Still too based on resources or activity data (to the detriment of outcomes information) Very limited connectivity between Regional health systems and across the country. No systematic assessment of SNS performance, whatever the level of disaggregation
While decision-making at national level has been decentralised, processes at regional level have been rather over-centralised and many of the old central approaches have just been copied. Devolution has arguably affected staff and patients /citizens voice on how health services are managed. Belenes, R. (2003) “Un balance personal de 25 años de gestión sanitaria moderna en el Sistema Nacional de Salud”, Gaceta Sanitaria 17 (2): 150-6; Flores Juberías, C. (2003) “Spain: delegation and accountability in a newly established democracy”, in StrØm, K., Müller, W., Bergman, T. (eds) Delegation and accountability in Parliamentary Democracies, Oxford University Press
National Healthcare Agreement involving all Regions and all Political Parties (not signed yet) - Human Resources Policy - Common Services - Budget Sustainability - Common Health Policies - Quality and Innovation - Prevention of Drug Addiction