Download
1 / 37
370 likes | 453 Views
Research focuses on improving models and forecasting of the carbon cycle, using data to test and evolve models of the biosphere, addressing uncertainties, and generating global estimates with quantified uncertainty. Challenges and progress are discussed, with comparisons of models and data to refine analyses. Objectives include parameter estimation and predicting carbon fluxes, with emphasis on various model-dataset fusion techniques. Constraints include consistency, confidence intervals, and linking stocks to fluxes. Challenges include equifinality and defining priors, with future work aiming to quantify model skill across biomes using Earth observations and manipulation experiments.

E N D
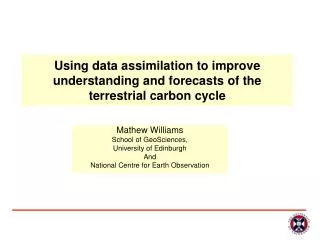
Improving understanding and forecasts of the terrestrial carbon cycle Mathew Williams School of GeoSciences, University of Edinburgh With input from: BE Law, A Fox, RF Fisher, J Grace, J Moncrieff, T Hill, P Meir, REFLEX team
Motivation • How is the Earth changing? • What are the consequences of these changes for life on Earth?
Climate Litterfall/ sedimentation Photosynthesis Combustion Respiration The Global Carbon Cycle – a simple model The Carbon Cycle Atmosphere Fossil Fuels (7 per yr) & volcanoes Vegetation Ocean Soils Sediments Understanding, prediction and control of the Carbon cycle
Research Vision • To use EO data to test, constrain, modify and evolve models of the terrestrial biosphere • To focus on uncertainty throughout the process of linking observations to models • To guide experimental and observational science towards critical areas of uncertainty • To generate global bottom-up estimates of the terrestrial C cycle with quantified uncertainty
Outline • The problems • Progress so far • Challenges for the future
Intercomparison of 11 coupled carbon climate models Friedlingstein et al 2006: C4MIP
Matrix of R2 for simulations of mean annual GPP for 36 major watersheds in Europe from different process- and data oriented models Williams et al. 2009, BGD
Time and space scales in ecological processes time dec Nutrient cycling Succession Climate change yr Adaptation Disturbance month Growth and phenology day Photosynthesis and respiration Climate variability hr Flask Site Physiology s Space (km) 0.1 1.0 10 100 1000 10000
Time and space scales in ecological observations time dec Flask Site GOSAT MODIS yr month Flux Tower Tall tower day Field Studies Aircraft hr Flask Site s Space (km) 0.1 1.0 10 100 1000 10000
Progress so far in MDF • Model-data fusion with multiple constraints to improve analyses of C dynamics (Williams et al. 2005, GCB) • Assimilating EO data to improve C model state estimation (Quaife et al. 2008, RSE) • REFLEX: Intercomparison experiment on parameter estimation using synthetic and observed flux data (Fox et al, in press, AFM) • “Improving land surface models with FLUXNET data” (Williams et al 2009, BGD)
C cycling in Ponderosa Pine, OR Flux tower (2000-2) Sap flow Soil/stem/leaf respiration LAI, stem, root biomass Litter fall measurements
Sap-flow A/Ci Chambers Chambers EC Time (days since 1 Jan 2000) Williams et al GCB (2005)
Senescence & disturbance Photosynthesis & plant respiration Phenology & allocation Microbial & soil processes Af Lf Cfoliage Rh Ra Ar Lr GPP Croot Clitter D Climate drivers Aw Lw Cwood CSOM/CWD Feedback from Cf Simple linear functions Non linear f(T)
The Kalman Filter Initial state Drivers Forecast Observations Predictions At Ft+1 Dt+1 F´t+1 MODEL OPERATOR P Assimilation At+1 Analysis
= observation — = mean analysis | = SD of the analysis Time (days since 1 Jan 2000) Williams et al GCB (2005)
= observation — = mean analysis | = SD of the analysis Time (days since 1 Jan 2000) Williams et al GCB (2005)
Data bring confidence & test the model =observation — = mean analysis | = SD of the analysis Williams et al, GCB (2005)
REFLEX experiment • Objectives: To compare the strengths and weaknesses of various MDF techniques for estimating C model parameters and predicting C fluxes. • Evergreen and deciduous models and data • Real and synthetic observations • Multiple MDF techniques • Links between stocks and fluxes are explicit www.carbonfusion.org
Parameter constraint Consistency among methods Confidence intervals constrained by the data Consistent with known “truth” “truth” Fox et al. in press
DALEC Model Ra Atolab Clab Afromlab Lf Cf Rh1 Rh2 Af Ar Lr GPP Cr Clit D Aw Lw Cw CSOM Fox et al. in press
Problems with SOM and wood Fox et al. in press
Problems so far • Varied estimation of confidence intervals • Equifinality • Problems in defining priors • Multiple time scales of response
Challenges for the future FLUXNET Quantifying model skill across biomes Williams et al. 2009, BGD
WP6 Earth observation WP4 Towers WP5 Airborne Arctic Biosphere-Atmosphere Coupling across multiple Scales ABACUS WP1 Plants WP2 Soils WP3 Fluxes WP Moss WP York
Other data constraints? • Tree rings • FPAR, NDVI, EVI time series • Stem inventories • chronosequences • Phenology observations • Soil moisture, LE, stream-flow • Surface temperature • Soil chambers
5 SPA model output vs. data Control : R2=0.81 Rp lmin v K v Drought : R2=0.75 LAI Root Met. Soil-Root Resistance (modelled) Fisher et al. 2007
Workflow for interpretation of GOSAT, flask, aircraft and tall tower data Global C fluxes Science questions Aircraft/ ground XCO2 Satellite XCO2 MODIS Calibration/ Validation Satellite XCO2 vs Models Flasks/aircraft Ground XCO2 Assimilation Flux analysis Model XCO2 Land surface model Fire Atmos. transport Model intercomparison Error/bias characterisation Science questions
Funding support: NERC NASA DOE Thank you
Information content of data (——) aircraft soundings + flux data (‑ ‑ ‑ ‑) flux data only; (— — —) aircraft soundings only Hill et al. in prep.
Quantifying driver uncertainty in carbon flux predictions Spadavecchia et al. in prep.
Parameter retrieval from a synthetic experiment using the DALEC model using EnKF Williams et al. 2009, BGD