Download
1 / 12
120 likes | 219 Views
This lecture covers key themes in statistics related to water resources, including simple and multiple linear regression, derivation of normal equations, and time series methods. Topics also include comparing independent groups, interpreting regression statistics, and assessing residuals. Formula derivations, data plotting, and F-test applications are discussed.

E N D
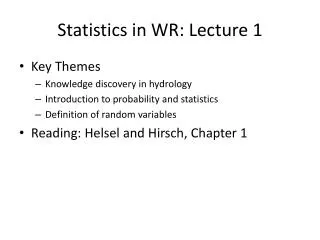
Statistics in WR: Lecture 11 • Key Themes • Simple Linear Regression • Derivation of the normal equations • Multiple Linear Regression • Reading: Helsel and Hirsch Chapter 7 Comparing several independent groups • Reading: Barnett, Environmental Statistics Chapter 10 Time series methods • Slides are from Helsel and Hirsch, Chapter 9
Durbin-Watson Statistic for testing autocorrelation of the residuals
F-distribution http://en.wikipedia.org/wiki/F-test “If U is a Chisquare random variable with m degrees of freedom, V is a Chisquare random variable with n degrees of freedom, and if U and V are independent, then the ratio [(U/m)/V/n) has an F-distribution with (m, n) degrees of freedom.” Haan, Statistical Methods in Hydrology, p.122 The values of the F-statistic are tabulated at: http://www.itl.nist.gov/div898/handbook/eda/section3/eda3673.htm