Download
1 / 8
130 likes | 303 Views
M&M Experiment Which color are you most likely to get?. Take out a sheet of paper and pen or pencil. Step 1. Step 2 Extend chart to convert the number of candies for each color into a fraction, decimal, & percent!. Step 3 Analyze your results by responding to the following questions.

E N D
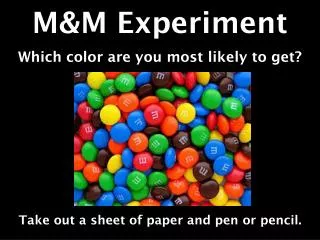
M&M Experiment Which color are you most likely to get? Take out a sheet of paper and pen or pencil.
Step 2 Extend chart to convert the number of candies for each color into a fraction, decimal, & percent!
Step 3 • Analyze your results by responding to the following questions. • According to your results, which color is most likely? Which color is least likely? • What is the sample space for picking an M&M in your package? • Is picking a blue or orange candy more likely? Why? • Do you have any colors that have equally likely outcomes? Explain! • A) What is the probability of picking an orange M&M? B) What is the probability of picking an orange or a yellow M&M? C) What is the probability of not picking an orange M&M? D) What is the probability of not picking an orange or a yellow M&M? • Did we calculate and examine theoretical or experimental probability? How do you know? Elaborate!!!
Step 4 • According to the M&M website, each package of milk chocolate M&M contains… • 24% Blue • 14% Brown • 16% Green • 20% Orange • 13% Red • 14% Yellow • Create a chart to show the amount of each color of candy that should be in your package!
Step 5 Since your sample size is small, combine class data to examine a larger sample size.
Step 6- Small Group Practice (QUIZ GRADE) • A) How do you find the theoretical probability of picking a yellow candy? B) How do you find the experimental probability of picking a yellow candy? C) Will these probabilities always be the same? Different? Neither? • A) How do you find the theoretical probability of not picking a yellow candy? B) How do you find the experimental probability of not picking a yellow candy? • Create a Venn Diagram to compare and contrast the similarities and differences between theoretical and experimental probability. You must have at least one item in every section of your Venn Diagram. • A) Compare the whole class color percentages as they relate to the theoretical probability given by the M&M company. B) Are the whole class color percentages closer to the theoretical probability than your individual color percentages?