Download
1 / 15
150 likes | 298 Views
Independent Component Analysis features of Color & Stereo images. Authors: Patrik O. Hoyer Aapo Hyvarinen CIS 526: Neural Computation. Presented by: Ajay Kumar Yadav. Overview. Introduction Background Study Data Preprocessing Color Image Experiment Stereo Image Experiment

E N D
Independent Component Analysis features of Color & Stereo images Authors: Patrik O. Hoyer Aapo Hyvarinen CIS 526: Neural Computation Presented by: Ajay Kumar Yadav
Overview • Introduction • Background Study • Data Preprocessing • Color Image Experiment • Stereo Image Experiment • Conclusion
Introduction • Visual Cortex: part of the cerebral cortex responsible for processing visual stimuli. (Static, Moving & Pattern Recognition) • Receptive fields are divided as: • Sub-regions that exert an excitatory influence. (light grey) • Sub-regions that exert an inhibitory influence. (dark grey) • Stimulus Influence also depends on size, orientation and position (Hubel & Wiesel’s -1962, DeValois-1982, DeAngelis-1993)
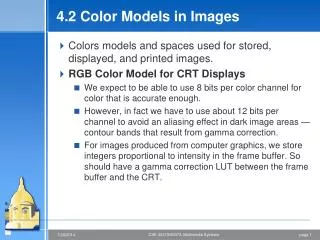
Contd.. • Cones consist of three cell each responsible for each RGB component. (tuned at wavelength of 430, 535, 590 nanometer) • The degree to which the images are non-corresponding is defined as binocular disparity. It is used to determine the distance of an object from oneself, and its relation to the fixation plane, is called stereopsis.
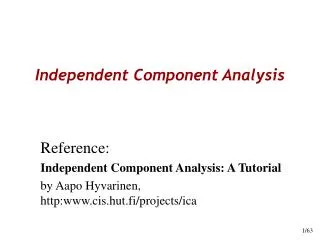
Background Study • The sparseness-maximization network and ICA are closely related. (Olshausen and Field 1997) • Hateren and Vander Schaaf qualitatively compared the filter learned by ICA to measurements of neural receptive fields. • Van Hateren and Ruderman proved ICA also fit the receptive field properties for video images.
Data Preprocessing • ICA preprocess the data in two steps: • The mean of the data is subtracted to center the data on the origin. • Whiten the data z = Vx, so that • Goal: ICA transform W to minimize the statistical dependencies between the estimated sources. • After convergence
Color Image Experiment • Standard RGB values are considered as input data assuming the transformation to cone outputs to be roughly linear. • A total of 50,000 12 by 12 pixel image patches were sampled randomly with dimensionality of 432. • Data is preprocessed and correlation matrix and eigen vectors are calculated. • Constant RGB value is used in the display.
Correlation matrix • Data is projected in 160 principle component before whitening. Two reasons are: • To emulate the real neuron functionality • Dimension is dropped to lower computational cost.
Results **ICA basis of color images** **Color content of three ICA filters** **Percentage of achromatic**
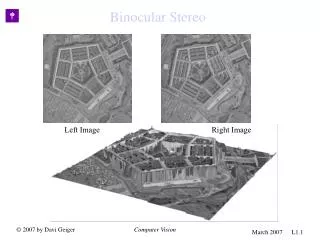
Stereo Image Experiment • Stereo image data: • 5 focus points at random from each image are selected and estimated the disparities. • Randomly sampled 16*16 pixel corresponding image in patch area of 300*300 pixels centered on each focus point. • Due to the fluctuation patches are often similar but horizontally shifted. • During the preprocessing local mean was removed from each component and correlation matrix and eigenvalue decomposition are calculated.
Stereo Images Equal Response Varying Response **PCA Basis of Stereo Image** **ICA Basis of Stereo Image**
Ocular Dominance • The shift from one eye to the other takes place over a distance of less than 50 microns, therefore column dominated by one eye. • If the sampling areas is smaller, correlation between the patches would be higher. • If the area gets larger, the dependencies between the left and right patches get weaker
Disparity Tuning Analysis • To analyze the disparity tuning several ICA basis were estimated using different number random seeds. • Only relatively high frequency well localized binocular vectors are selected
Disparity Tuning Curves • Each patch is shown to both the eyes to get the tuning curve and the mean is considered as final curve. • These curves are defined in two parts: • Tuned excitatory • Tuned inhibitory • Tuned excitatory shows a strong peak at zero. • Tuned inhibitory shows opposite polarity. • Near unit’s right receptive slightly shifted giving positive preferred disparity. • Far unit has opposite positional offset with negative disparities.
Conclusion • ICA could be applied in denoising, compression or pattern recognition of color or stereo data. • ICA can be used to model computational properties of visual cortex (V1) cell. • Limitation: • Since ICA emulate the behavior of cones it may fail in dark or un-illuminated images. • To get better correlation basis patch needed to be small which may vary. • Nonlinearities inherent in the conversion from RGB to cones response will affect the ICA result.