Download
1 / 16
160 likes | 253 Views
This paper discusses queue control functions for switch schemes and their impact on stability and robustness. It explores design principles and presents simulation results for various queue control functions. The study highlights the importance of queue control in maintaining network performance.

E N D
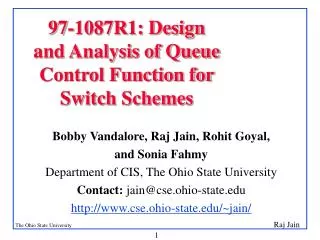
97-1087R1: Design and Analysis of Queue Control Function for Switch Schemes Bobby Vandalore, Raj Jain, Rohit Goyal, and Sonia Fahmy Department of CIS, The Ohio State University Contact: jain@cse.ohio-state.edu http://www.cse.ohio-state.edu/~jain/
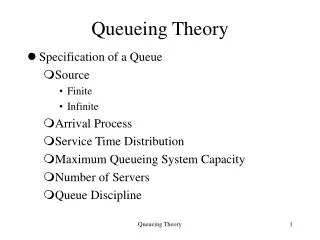
Overview • Switch Scheme Model • Queue Control Functions • Metrics • Analytical Explanation (in the contribution) • Simulation Results • Conclusion
Queue Control Function • Used to adjust switch congestion feedback (ER) based on the queue length • Target rate = f(q) × fn{current load, link rate, Higher priority (CBR, VBR) load}f(q) is the queue control function. • Assume explicit rate feedback switch(Results may not apply to EFCI switch) • ERICA+ fits the above model • Queue control is required for stability and robustness
Background • For real-time ABR: • Queue lengths should be smallÞ Queue control is required • Any change in ACR changes qualityÞ ACR should remain constant for some time • Queue control should be simple. Can we use simple static queue thresholds?
Design Principles 1. If queue length is very small, increase it Þ f(Q) is greater than one 2. In steady state, queue should be constant Þ f(Q) =1. 3. If queue length is large, use part of link capacity to drain the queue Þ f(Q) < 1 4. Not all of link capacity should be used for draining Þ threshold for f(Q), known as queue drain limit factor (QDLF) 5. f(Q) has to be continuous. Discontinuities Þ oscillations in Q lengths and rates
Step, Linear and Hyperbolic Functions Step Hyperbolic sb Linear with slopes mb and ma 1 f(Q) sa Queue Control Function QDLF Q0 Q1 Q2 Q (Queue Length)
Metrics • Convergence time seen in graph • Mean queue length • Standard deviation of ACR before t = 1s • Standard deviation of ACR after t = 1s
Configuration 1 • Simple configuration • N infinite ABR sources, N ABR destinations • One way traffic. From sources to destinations. Source 1 Destination 1 Bottleneck Link Source 2 Destination 2 Switch 1 Switch 2 Destination N Source N 1000 Km 1000 Km 1000 Km
1600 1400 Acr 2 Acr 1 Acr 3 1200 1000 Time in milliseconds 3-ABR : ACRs 800 600 400 200 0 0 80 60 40 20 160 140 120 100 ACRs Step Function Graphs sa = 1.05, sb = 0.95, Q1 = 4Q0, Q2 = 26Q0
3-ABR : ACRs 140 Acr 1 120 Acr 2 100 ACRs 80 60 40 20 0 800 1600 400 200 600 1000 1400 1200 Time in milliseconds Linear Function Graphs ma = 1/16, mb = 1/16,Q1 = 4Q0,Q2 = 26Q0 Acr 3
Hyperbolic Func. Graphs ha = 1.15, hb = 1.05,Q1 = 4Q0,Q2 = 26Q0 3-ABR : ACRs 140 Acr 1 Acr 2 120 Acr 3 100 ACRs 80 60 40 20 1400 1000 600 200 1600 1200 400 800 0 Time in milliseconds
Results • Table 1: Simple configuration: Results
Observations • Step function never converged • Linear and hyperbolic functions reached steady state • As Q1 increases Þ Convergence time increases • For Q1 = 2Q0 linear function converged, hyperbolic had small oscillations • Q1 = 8Q0 convergence time for hyperbolic is more than linear function’s.
Configuration 2 • Generic Fairness Configuration (GFC-2) • D - distance of links = 1000 Km D(1) E(2) H(2) A(3) F(1) G(7) C(3) D 4D 2D D D 2D SW1 SW2 SW3 SW7 A(1) SW4 SW5 SW6 50 50 150 100 150 50 Mbps Mbps Mbps Mbps Mbps Mbps E(2) C(3) A(1) D(1) B(1) B(1) G(7) F(1) B(1) H(2) Congested link for B VCs A(1) Congested link for A VCs Congested link for C VCs
GFC-2 Configuration: Results Step function has larger rate and queue length variations than linear and hyperbolic functions
Summary • Less oscillations in rates and queue length Þ support for low quality video over ABR • Step (multiple thresholds) function is not good • Hyperbolic and linear provide good queue control functions • Linear function is recommended for simpler implementation