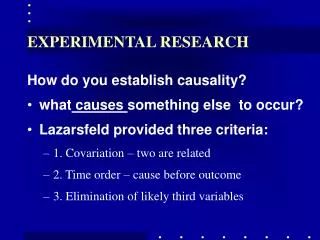
Experimental Research
Experimental Research. What is an Experiment?. Research method in which conditions are controlled so that 1 or more independent variables can be manipulated to test a hypothesis about a dependent variable . Allows evaluation of causal relationships among variables

Experimental Research
E N D
Presentation Transcript
What is an Experiment? • Research method in which • conditions are controlled • so that 1 or more independent variables • can be manipulated to test a hypothesis • about a dependent variable. • Allows • evaluation of causal relationships among variables • while all other variables are eliminated or controlled.
Some Definitions • Dependent Variable • Criterion by which the results of the experiment are judged. • Variable that is expected to be dependent on the manipulation of the independent variable • Independent Variable • Any variable that can be manipulated, or altered, independently of any other variable • Hypothesized to be the causal influence
More Definitions • Experimental Treatments • Alternative manipulations of the independent variable being investigated • Experimental Group • Group of subjects exposed to the experimental treatment • Control Group • Group of subjects exposed to the control condition • Not exposed to the experimental treatment
More Definitions • Test Unit • Entity whose responses to experimental treatments are being observed or measured • Randomization • Assignment of subjects and treatments to groups is based on chance • Provides “control by chance” • Random assignment allows the assumption that the groups are identical with respect to all variables except the experimental treatment
Constant Error (bias) • Constant error is error that occurs in the same experimental condition every time the basic experiment is repeated – a systematic bias • Example: • Experimental groups always administered the treatment in the morning • Control groups always in the afternoon • Introduces an uncontrolled extraneous variable – time of day • Hence, systematic or constant error • Extraneous Variables • Variables other than the manipulated variables that affect the results of the experiment • Can potentially invalidate the results
Sources of Constant Error • Demand Characteristics • Experimental design procedures or situational aspects of the experiment that provide unintentional hints to subjects about the experimenter’s hypothesis • If occurs, participants likely to act in a manner consistent with the experimental treatment. • Most prominent demand characteristic is the person actually administering the experimental treatments. • Experimenter Bias • Effect on the subjects’ behavior caused by an experimenter’s presence, actions, or comments. • Guinea Pig Effect • Effect on experimental results caused by subjects changing normal behavior or attitudes to cooperate with experimenter.
Controlling Extraneous Variables • Blinding • Technique used to control subjects’ knowledge of whether or not they have been given the experimental treatment. • Taste tests, placebos (chemically inert pills), etc. • Constancy of Conditions • Subjects in experimental & control groups are exposed to identical situations except for differing conditions of the independent variable.
Controlling Extraneous Variables • Order of Presentation • If experimental method requires that the same subjects be exposed to 2 or more experimental treatments, error may occur due to order in which the treatments are presented • Counterbalancing • ½ the subjects exposed to Treatment A first, then to Treatment B. • Other ½ exposed to Treatment B first, then to Treatment A. • Eliminates the effects of order of presentation
Experimental Validity • Internal Validity • Indicates whether the independent variable was the sole cause of the change in the dependent variable • External Validity • Indicates the extent to which the results of the experiment are applicable to the real world
Extraneous Variables that Jeopardize Internal Validity • History Effect • Specific events in the external environment between the 1st & 2nd measurements that are beyond the experimenter’s control • Common history effect occurs when competitors change their marketing strategies during a test marketing experiment • Cohort Effect • Change in the dependent variable that occurs because members of one experimental group experienced different historical situations than members of other experimental groups
Extraneous Variables that Jeopardize Internal Validity • Maturation Effect • Effect on experimental results caused by experimental subjects maturing or changing over time • During a daylong experiment, subjects may grow hungry, tired, or bored • Testing Effect • In before-and-after studies, pretesting may sensitize subjects when taking a test for the 2nd time. • May cause subjects to act differently than they would have if no pretest measures were taken
Extraneous Variables that Jeopardize Internal Validity • Instrumentation Effect • Caused by a change in the wording of questions, in interviewers, or in other procedures used to measure the dependent variable. • Selection Effect • Sampling bias that results from differential selection of respondents for the comparison groups. • Mortality or Sample Attrition • Results from the withdrawal of some subjects from the experiment before it is completed • Effects randomization • Especially troublesome if some withdraw from one treatment group and not from the others (or at least at different rates)
Figure 8.3 Experimentation as Conclusive Research Figure 8.3 Experimentation as Conclusive Research Conclusive Research Descriptive Causal Experimentation Field Experiments Laboratory Experiments
Symbolism for Diagramming Experimental Designs X = exposure of a group to an experimental treatment O = observation or measurement of the dependent variable If multiple observations or measurements are taken, subscripts indicate temporal order – I.e., O1, O2, etc. = random assignment of test units; individuals selected as subjects for the experiment are randomly assigned to the experimental groups R
Pre-Experimental Designs • Do not adequately control for the problems associated with loss of external or internal validity • Cannot be classified as true experiments • Often used in exploratory research • Three Examples of Pre-Experimental Designs • One-Shot Design • One-Group Pretest-Posttest Design • Static Group Design
One-Shot Design • A.K.A. – after-only design • A single measure is recorded after the treatment is administered • Study lacks any comparison or control of extraneous influences • No measure of test units not exposed to the experimental treatment • May be the only viable choice in taste tests • Diagrammed as: X O1
One-Group Pretest-Posttest Design • Subjects in the experimental group are measured before and after the treatment is administered. • No control group • Offers comparison of the same individuals before and after the treatment (e.g., training) • If time between 1st & 2nd measurements is extended, may suffer maturation • Can also suffer from history, mortality, and testing effects • Diagrammed as O1 X O2
Static Group Design • A.K.A., after-only design with control group • Experimental group is measured after being exposed to the experimental treatment • Control group is measured without having been exposed to the experimental treatment • No pre-measure is taken • Major weakness is lack of assurance that the groups were equal on variables of interest prior to the treatment • Diagrammed as: Experimental Group X O1 Control Group O2
Pretest-Posttest Control Group Design • A.K.A., Before-After with Control • True experimental design • Experimental group tested before and after treatment exposure • Control group tested at same two times without exposure to experimental treatment • Includes random assignment to groups • Effect of all extraneous variables assumed to be the same on both groups • Do run the risk of a testing effect
Pretest-Posttest Control Group Design • Diagrammed as • Experimental Group: O1 X O2 • Control Group: O3 O4 • Effect of the experimental treatment equals (O2 – O1) -- (O4 – O3) • Example • 20% brand awareness among subjects before an advertising treatment • 35% in experimental group & 22% in control group after the treatment • Treatment effect equals (0.35 – 0.20) – (0.22 – 0.20) = 13% R R
Posttest-Only Control Group Design • A.K.A., After-Only with Control • True experimental design • Experimental group tested after treatment exposure • Control group tested at same time without exposure to experimental treatment • Includes random assignment to groups • Effect of all extraneous variables assumed to be the same on both groups • Do not run the risk of a testing effect • Use in situations when cannot pretest
Posttest-Only Control Group Design • Diagrammed as • Experimental Group: X O1 • Control Group: O2 • Effect of the experimental treatment equals (O2 – O1) • Example • Assume you manufacture an athlete’s foot remedy • Want to demonstrate your product is better than the competition • Can’t really pretest the effectiveness of the remedy R R
Solomon Four-Group Design • True experimental design • Combines pretest-posttest with control group design and the posttest-only with control group design • Provides means for controlling the interactive testing effect and other sources of extraneous variation • Does include random assignment
Solomon Four-Group Design • Diagrammed as • Experimental Group 1: O1 X O2 • Control Group 1: O3 O4 • Experimental Group 2: X O5 • Control Group 2: O6 • Effect of independent variable (O2 – O4) & (O5 – O6) • Effect of pretesting (O4 – O6) • Effect of pretesting & measuring (O2 – O5) • Effect of random assignment (O1 – O3) R R R R
Quasi-Experimental Designs • More realistic than true experiments • Researchers lacks full control over the scheduling of experimental treatments or • They are unable to randomize • Includes • Time Series Design • Multiple Time Series Design • Same as Time Series Design except that a control group is added
Time Series Design • Involves periodic measurements on the dependent variable for a group of test units • After multiple measurements, experimental treatment is administered (or occurs naturally) • After the treatment, periodic measurements are continued in order to determine the treatment effect • Diagrammed as: O1 O2 O3 O4 X O5 O6 O7 O8
Statistical Designs • Multiple experiments are conducted simultaneously to permit extraneous variables to be statistically controlled and • Effects of multiple independent variables to be measured • Advantages • Can measure the effects of more than one independent variable • Can statistically control specific extraneous variables • Economical designs can be formulated when each subject is measured more than once.
Completely Randomized Design • Involves randomly assigning treatments to group members • Allows control over all extraneous treatments while manipulating the treatment variable • Simple to administer, but should NOT be used unless test members are similar, and they are also alike regarding a particular extraneous variable • Different forms of the independent variable are called “levels.”
Completely Randomized DesignExample • Grocery store chain trying to motivate consumers to shop in their stores • 3 possible sales promotional efforts X1 = offer discount of 5% off total shopping bill X2 = offer taste sample of selected foods X3 = control group, no sales promotional effort applied
Randomized Block Design • Randomly assigns treatments to experimental & control groups • Test units broken into similar blocks (or groups) according to an extraneous variable • I.e., location, age, gender, income, education, etc. • Particularly useful when small sample sizes are necessary
Randomized DesignExample • Grocery store chain trying to motivate consumers to shop in their stores • 3 possible sales promotional efforts X1 = offer discount of 5% off total shopping bill X2 = offer taste sample of selected foods X3 = control group, no sales promotional effort applied Blocks = time stores have been in operation
Latin Square Design • Allows control or elimination of the effect of two extraneous variables • Systematically blocks in 2 directions by grouping test units according to 2 extraneous variables • Includes random assignment of treatments to each cell in the design • Used for comparing t treatment levels in t rows and t columns • I.e., if we have 3 treatment levels, we must have 3 rows and 3 columns
Latin Square Design where A, B, & C are all treatments
Factorial Design • Used to examine the effects that the manipulation of at least 2 independent variables (simultaneously at different levels) has upon the dependent variable • The impact that each independent variable has on the dependent variable is referred to as the main effect • Dependent variable may also be impacted by the interaction of the independent variables. This is called the interaction effect
Factorial Design Example • Grocery store chain wants to use 12 of its stores to examine whether sales would change at 3 different hours of operation and 2 different types of sales promotions • Dependent variable is change in sales • Independent variables • Store open 6 am to 6 pm • Store open 6 am to midnight • Store open 24 hours/day • Sales promotion: samples for a free gift • Sales promotion: food samples • Called a 3 x 2 factorial design • Need 6 experimental groups (3 x 2 = 6)
Test Marketing • Controlled experiment conducted on a small segment of the target market • Major objectives • Determine how well products will be accepted in the marketplace • Determine how changes in marketing mix will likely affect product success • Major reason for test marketing is risk reduction • Lose $ 1 million in test market or $ 50 million on product failure? • Problems • Expense • Time • Competitors can disrupt
Factors to Consider • Population size • Demographic composition • Lifestyle considerations • Competitive situation • Media coverage & efficiency • Media isolation • Self-contained trading area • Overused test markets • Loss of secrecy