Experimental Research
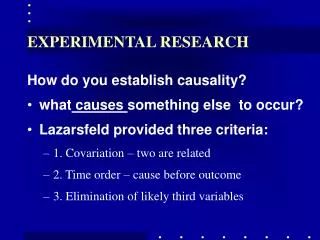
Experimental Research. by Dr. Daniel Churchill. Task Presentation. Correlational Research Question. What is Experimental Research. Test hypotheses concerning cause and effect relationships

Experimental Research
E N D
Presentation Transcript
Experimental Research by Dr. Daniel Churchill
Task Presentation • Correlational Research Question
What is Experimental Research • Test hypotheses concerning cause and effect relationships • A researcher manipulates at least one independent variable, controls other variables and observes effect on one or more independent variables. • Usually there are different groups of subjects who get different treatment • Individuals randomly assigned to treatment groups
Experimental research • Most studies compare groups • When individuals are studies, the studies are called single-case (or single subject) designs.
Experimental Process • Six steps to conducting experimental research • Selection and definition of the problem • Statement of a hypothesis indicating a causal relationship between variables • Selection of participants and instruments • Random selection of a sample of subjects from a larger population • Random assignment of members of the sample to each group • Selection of valid and reliable instruments
Experimental Process • Six steps to conducting experimental research (cont.) • Selection of a research plan • Three types of comparisons • Comparison of two different approaches • Comparison of new and existing approaches • Comparison of different amounts of a single approach • Execution of the research plan • Two concerns • Sufficient exposure to the treatment • Substantively different treatments
Experimental Process • Six steps to conducting experimental research (cont.) • Analysis of data • Formulation of conclusions
Manipulation and Control • Manipulation • The researcher’s decisions related to what constitutes the independent variable • Active and assigned variables • Active variables are those the researcher actively manipulates • Choice of an instructional strategy • A particular counseling approach • Assigned variables are those that cannot be manipulated by the researcher but are of interest • Gender • Race
Manipulation and Control • Control • The researcher’s efforts to remove the influence of any extraneous variables that might have an effect on the dependent variable • The goal is to be assured the only differences between groups is that related to the independent variable • Participant variables – characteristics of the subjects • Pre-existing achievement levels • Differences in attitudes • Environmental variables – characteristics of the context • Learning materials • Differences in the time available for treatment between groups
Group Designs • Two major classes of group designs • Single-variable designs – one independent variable • Factorial designs – two or more independent variables • Three types of experimental designs • Pre-experimental designs • Experimental designs • Quasi-experimental designs
Pre-Experimental Designs • Three types • One-shot case study • X O • One-group pretest-posttest design • O X O • Static group comparison • X1 O X2 O • Threats to internal validity – see Figure 9.1
True Experimental Designs • Three types • Pretest-posttest control group design • R O X O R O O • Posttest only control group design • R X O R O
True Experimental Designs • Three types (cont.) • Solomon four-group comparison • R O X O R O O R X O R O • Threats to internal validity – see Figure 9.2
Quasi-Experimental Designs • Three types • Non-equivalent control group design • O X O O O • Time series design • O O O O X O O O O • Counterbalanced design • O X1 O X2 O X3 O O X3 O X1 O X2 O O X2 O X3 O X1 O • Threats to internal validity – see Figure 9.2
Factorial Designs • Two independent variables and one dependent variable • The effect of teaching strategy and gender on students’ achievement • The effect of a particular counseling technique and the clients’ ethnicity on the success of the treatment • The effect of a specific coaching approach and children in three age groups on the ability to perform certain physical tasks
Factorial Designs • Interaction • Visually explained by a graph of performance of all levels of both independent variables • Parallel lines indicate no interaction • Non-parallel lines indicate an interaction • Statistically examined with an F-test of the statistical significance of the interaction
Factorial Designs • Interaction • Visual presentation of a significant interaction • Statistical analysis of this significant interaction: F1,16 = 4.88 (p = .0420)
Factorial Designs • Interaction • Visual presentation of a non-significant interaction • Statistical analysis of this non-significant interaction: F1,16 = 0.97 (p = .340)
Inferential Statistics • Applied only when groups are compared • T-test is used to compare experimental group to control group, boys to girls, pre-tests to post-tests, etc • The numbers used for comparison are means • Interval or ratio scale derived form the same measure (e.g., same test)
Hypotheses for t-test • H0 Mean 1= Mean 2 • HA Mean 1 Mean 2 • T value is calculated using a specific formula • Statistical tables are used to determine level of significance (check http://www.statsoft.com/textbook/sttable.html) • H0 is kept or rejected (check the table)
Inferential Statistics • ANOVA is used to compare mean of two or more samples and to test whether the differences are statistically significant.
Useful reading • Here is a useful reading written by HKU professor • Interesting resource for learning about statistics is available here:http://www.mnstate.edu/wasson/ed602.htm
Task to be completed before next class • Your group should discuss some possible question that can be classified as Experimental Research. In your blog propose potential experimental research question, how could data for the related variables be collected, and provide argument how answer to that question can contribute to improvements in some aspect of education/teaching and learning.
References • Gay, L. R., Mills, G. E., & Airasian, P. (2006). Educational Research: Competencies for Analysis and Applications. Upper Saddle River, N.J. : Pearson/Merrill Prentice Hall. • Ravid, R. (2000). Practical statistics for educators. (2nd ed). New York, NY.: University Press of America, Inc.