Download
1 / 22
220 likes | 239 Views
Explore flood history in Ventura, CA, advanced hydrologic prediction service, impact assessment, rescue and recovery efforts, mapping for future flood studies.

E N D
Flood Risk and Recovery in Ventura, CA Ryan Graham Susannah Pitman Chris Castillo Billy Dole Dani Luna Diego Pedreros
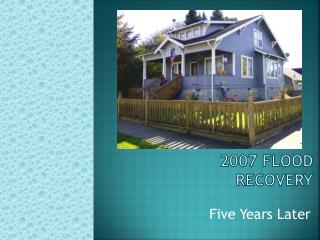
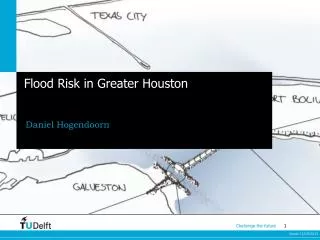
Background Cities along Ventura River - Oak View - Ventura In February, 1992, Ventura Beach RV Park Resort flooded by Ventura River
Background USGS Highest Flows Since 1933: Jan. 5, 1969 reached 58,000 CFS - gauge ht 24.3 ft Feb. 10, 1978 reached 63,600 CFS - gauge ht 19 ft Feb. 12, 1992 reached 45,800 CFS - gauge 20.66 ft Jan. 10, 1995 reached 43,700 CFS - gauge 21.16ft
Backgroundhttp://ahps2.wrh.noaa.gov/ahps2/hydrograph.php?wfo=lox&gage=vrvc1 Advanced Hydrologic Prediction service
Objectives • Provide a service GIS model for future flood studies • Protect the economic investments and interests of community • Facilitate Rescue, Recovery, Prevention • Aid in land use policy and recreation
Map of the Ventura River Three Parts
Methods and Procedure Three Parts to the Procedure: • The Event • The Physical and Social Impact • Rescue and Recovery
1. The Event • Identify the site (the creek a.k.a the event) • Need to find data: - rain gauges - hydrographs 3 highest peaks - Imagery air photos Landsat data
Hydrographhttp://nwis.waterdata.usgs.gov/ca/nwis/peak/?site_no=11118500&agency_cd=USGSHydrographhttp://nwis.waterdata.usgs.gov/ca/nwis/peak/?site_no=11118500&agency_cd=USGS
Hydrographhttp://nwis.waterdata.usgs.gov/ca/nwis/peak/?site_no=11118500&agency_cd=USGSHydrographhttp://nwis.waterdata.usgs.gov/ca/nwis/peak/?site_no=11118500&agency_cd=USGS
2. Physical and Social Impact • Transportation – roads, railroad, airports • Livelines – gas, water, sewage, electricity • Buildings – schools, residential, business • Land use – agriculture • Communication systems – cell towers, radio stations
2. Phys. And Soc. Continued • Economic – jobs, income • Population breakdowns – families, age • Property value • Displaced population
3. Rescue and Recovery Depends heavily upon physical and social Impacts: • Roads blocked and closed • Flooding of emergency areas • Economic losses and damages • Funds for repair
USGS - rain gauges - DEM MIL - Aerial photos Census Data Ventura Community On site Inspection Data sources
Locating affected areas Finding associated ancillary related to past events Predicting future floods Finding accurate census data for the social impacts Difficulty communicating and distributing information to residents Anticipated Problems
Likely Results • Providing service to search & rescue and the fire department • Restricting land use to low intensity recreation and economic activity • Produce three thematic flood prediction maps Ultimately… Saving Ventura