Download
1 / 15
150 likes | 352 Views
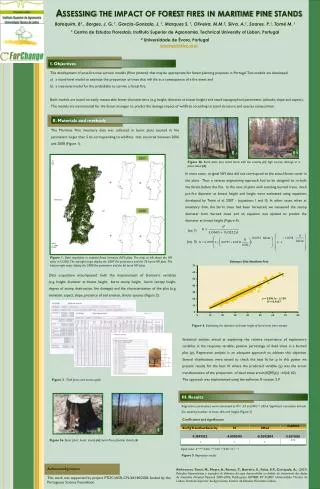
The Social Construction of Vulnerability to Forest Fires in Portugal. Fantina PEDROSA, Faculty of Arts, University of Porto Ricardo GOMES, Faculty of Arts, University of Porto António PORTOCARRERO, Faculty of Arts, University of Porto Salete CARVALHO, Faculty of Arts, University of Porto.

E N D
The Social Construction of Vulnerability to Forest Fires in Portugal • Fantina PEDROSA, Faculty of Arts, University of Porto • Ricardo GOMES, Faculty of Arts, University of Porto • António PORTOCARRERO, Faculty of Arts, University of Porto • Salete CARVALHO, Faculty of Arts, University of Porto The Third International Population Geographies Conference Liverpool, 2006
Objectives This paper intends to point out: ♣ the necessity to consider forest fires as an human event. ♣ the importance of the role played by population geography in contributing to the definition of measures to decrease the number of fire ignitions and reduce burnt area.
Contents Portuguese Forests: some statistical data Forest profitability Forest fires – Dimension of the disaster Population in Forest fire Risk maps Case-study: preliminary results
Portuguese Forest • Some statistical data ♣Forest covers about38% of the territory (3.4 million ha). ♣93.4% of forest land is private property. It comprises 400 000 land owners. 7.8% is managed by a land-owner association (AFOCELCA); 85.6% is dispersed by small land-owners. ♣6,4% of forest land is owned by the Portuguese State
Forestry profitability • ♣Forestry Sector creates 160 000 direct jobs (3,3% of active population) and 300 000 indirect jobs. • ♣Forestry products assure the activity of over 7.000 companies • ♣ 4% of Portugal's GDP • ♣ 11% of Portugal’s exports • ♣ In Portugal wealth extraction from forest amounts to 344 Euros/ha • Spain 90 Euros/ha and France 292 Euros/ha* • *Mendes, A; [et al.]. – 2004. The Portuguese Forests. Country level report delivered • to the EFFE Project, Evaluating Financing of Forestry in Europe. Porto: • Portuguese catholic university, Porto Regional Center, Faculty of Economics and • Management.
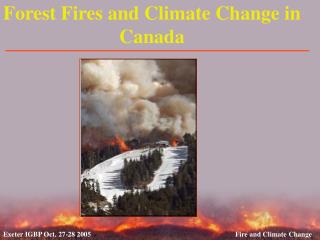
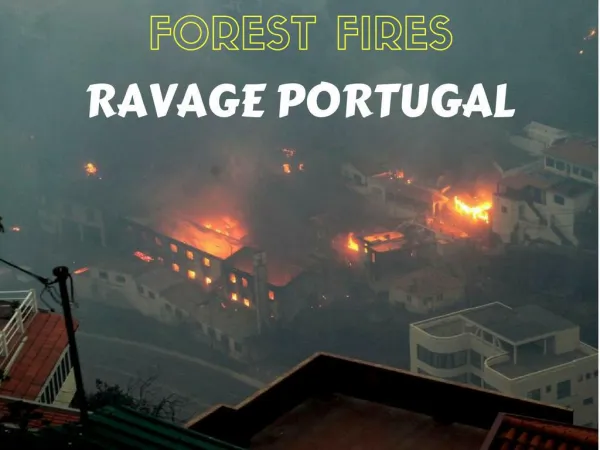
Forest Fires – Dimension of the Disaster ♣ Over the last 25 years, 2.7 million ha of forest were destroyed by fires. In the period of 2000-2005 about 1.1 million ha of forest were destroyed. ♣In the 1960s on average 10 000 ha of forest burnt every year. Over the last 5 years burnt area amounted on average to 190 000 ha/year. ♣ In the period of 2000-2005, forest fires caused 38 deaths, many injured, destroyed hundreds of dwellings and agricultural lands. ♣In Portugal the probability of a forest area to burn is 4 to 5 times higherthan in other Southern European countries.
Distribution of forest fire causes in the different districts Natural Negligence Accidentals Intencionals Causes/District 2001/2005 Source: Forest Fire Final Report 2005
Population in Forest Fire Risk Maps ♣ Structural approach (E.g. Maps of Portuguese Geographical Institute) ♣ Variables: Land Cover Slopes Road System/Network Slope Exposure Population Density Visibility from observation stations ♣ Useful to define risk areas to manage interventions ♣ Useful to define distribution and localisation of water points and technical fire-fighting equipment. ♣ Conjunctural approach (E.g. by the Portuguese Meteorological Institute using Fire Weather Index) ♣ Estimates using meteorological indicators (FWI) and calibrated data by district using the history of occurrences among others. ♣ Useful in the dailyassessment of meteorological conditions favourable to the breaking of fires of large intensity. ♣ Useful to assess the needs of the means on alert
Case- study Municipality of Baião(North of Portugal)
Preliminary Survey Results 1- Has forest fire severity increased over the last few years? ♣ The perception that the severity of forest fires has increased is consensual (94,1%) ♣ The perception that the duration of forest fire season has increased is consensual This perception is not entirely explained by the fact that the surveyed population has suffered losses caused by forest fires. This perception does not lead the population to adopt prevention measures and change behaviour risks. Of the surveyed population, only 48% of those who consider that the severity of forest fires has increased has adopted prevention measures.
2 – What is the degree of responsibility of the different agents in the management of forest fires? • ♣ The government is the agent with the major responsibility in the management of forest fires (78%). • ♣ The citizens also have great responsibility (68%) • The citizens who are fire-fighters attribute to the citizens a minor importance (56%) • ♣ Fire-fighters(49%) • ♣ The municipalities • Less educated people tend to attribute a minor importance to the capacity of citizens and municipalities in the management of forest fires. • The citizens aged between 35 and 50 years old attribute to the population a minor responsibility in the management of forest fires.
3 – What are causes of forest fires? ♣ Arson (83%) ♣ Negligence of citizens (33%) ♣ Agricultural burning (to burn agricultural waste) (20%) ♣ Prescribed burning (20%) Explained by : ♣ Existence of biomass (lack of cleaning of flammable vegetation and debris) ♣ Abandonment of agricultural areas ♣ Decrease of pasture lands It is consensual that the population considers forest fires as inevitable since they are criminal acts. There is no significant difference between the way men and women face forest fire causes, although men attribute greater importance to the negligence of citizens than women.
4 –How effective are the actions of forest fire prevention? ♣ Prohibitive measures- considered little effective, except the prohibition of lighting fires in the forest (measure considered effective by 90% of the surveyed population) ♣ Preventive measures – considered by the population with different degrees of efficacy, among the most effective are: cleaning of forest (90%) creating reduced fuel zones (60%) pescribed fire (58%).
5 – What are the most effective information means in conveying forest fire prevention measures? Local Schools (79%) TV (77%) Contact with representative of municipality (47%) Priest (43%)
Conclusion: • The statistical data on forest fires (detection time, hour of first intervention, duration of forest fires, teams employed in combat, rescue organisation, delimitation of area,…) includes some errors, whose extension is important to assess. • The prevention of forest fires should be carried out taking into consideration the local characteristics, thus vulnerability cartography and forest fire risk should be dynamic and operational; this is why the employment of GIS technology is an important tool for a more effective management of the resources. • To elaborate a dynamic cartography of the interests of forest fires at the local level would allow a better rationalisation of the resources and a greater efficacy. • The local population should be involved in the entire process related with forest fires: • In the prevention of forest fires; • How to act in case of fire; • Rehabilitation of burnt areas.