Download

1 / 44
440 likes | 610 Views
Based in part on Longley et al. Chapters 3 and 4. The Nature of Geographic Data. What are Geographic Data?. “Location, location, location!” to map, to link based on the same place, to measure distances and areas Attributes physical or environmental

E N D
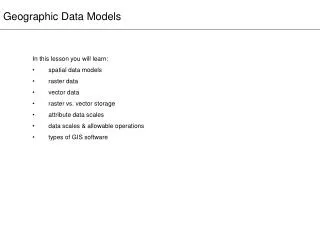
Based in part on Longley et al. Chapters 3 and 4 The Nature of Geographic Data
What are Geographic Data? • “Location, location, location!” • to map, to link based on the same place, • to measure distances and areas • Attributes • physical or environmental • soci-economic (e.g., population or income) • Time • height above sea level (slow?) • Sea surface temperature (fast)
Problems w/ Representing Geographic Data • Digital Earth • Entire Earth into single digital representation • Infinite complexity • What to leave in, what to leave out • Representations are partial (data models)
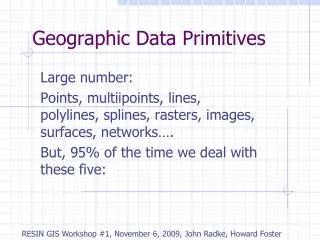
Discrete Objects and Continuous Fields( Vector and Raster Structures) DISCRETE • Well-defined boundaries in empty space • “Desktop littered w/ objects” • World littered w/ cars, houses, etc. • Counts • 49 houses in a subdivision
Dimensionality of Objects:A way of identifying them 0-D 1-D 2-D
The discrete object view leads to a powerful way of representing geographic information about objects Example of representation of geographic information as a table. The locations and attributes are for each of four grizzly bears in the Kenai Peninsula of Alaska. Locations, in degrees of longitude and latitude, have been obtained from radio collars. Only one location is shown for each bear, at noon on July 31, 2000.
Fields:Not points, lines, areas, but what varies and how smoothly…. “What occurs everywhere” care to count every peak, valley, ridge, slope???
Data Models and Data Structures Data Models: fields and objects are no more than conceptualizations, or ways in which we think about geographic phenomena. They are NOT always designed to deal with the limitations of computers. Field & Object Data Models Data Structures: methods of representing the data model in digital form w/in the computer Raster and Vector Data Structures
Mixed Pixels Examples of the largest share rule, where a cell's value is on the value that occupies the largest share of the cell's area, and the central point rule, where a cell's value is based on the value that occupies the central point of the cell.
Vector Data Structure:Lines vs. Polygons An area (red line) and its approximation by a polygon (blue line).
Sliver Slivers due to double digitizing and overlay can be eliminated.
Rasters and Vectors Flat File Vector-based line 4753456 623412 4753436 623424 4753462 623478 4753432 623482 4753405 623429 4753401 623508 4753462 623555 4753398 623634 Raster-based line Flat File 0000000000000000 0001100000100000 1010100001010000 1100100001010000 0000100010001000 0000100010000100 0001000100000010 0010000100000001 0111001000000001 Now YOU! 0000111000000000 0000000000000000
Topology • Science and mathematics of geometric relationships • Simple features + topological rules • Connectivity • Adjacency • Shared nodes / edges • Topology needed by • Data validation • Spatial analysis (e.g. network tracing, polygon adjacency)
An Object Model uses a Vector (Arc/Node) Data Structure • Object data model evolved into the arc/node variation in the 1960s. • Points in sequence build lines. • Lines have a direction - nodes or ordering of the points. • Lines in sequence build polygons.
Vectors (Arcs) and Topology • Vectors without topology are spaghetti structures. • Points, lines, and areas • stored in their own files, with links between them. • stored w/ topology (i.e. the connecting arcs and left and right polygons). • Relationships are computed and stored
Connectedness, Adjacency, Contiguity, Geo-Relational 2, -7, 5, 6
Topology, GIS, and You • Topological data structures very important in GIS software. • Must BUILD topology from unconnected arcs • rarely are maps topologically clean when digitized, imported, or “GPSed.” • “Tolerances” important - features can move or disappear • “snapping”, elimination, merging, etc.
(xmax, ymax) (xmin, ymin) The bounding rectangle
Why Topology Matters • allows automated error detection and elimination. • allows many GIS operations to be done without accessing the (x,y) files. • makes map overlay feasible. • makes spatial analysis possible.
TIN: Triangulated Irregular Network • Based on the Delaunay triangulation model of a set of irregularly distributed points. • Way to handle raster data with the vector data structure. • Common in most GISs. • More efficient than a grid.
triangulation TIN surface pseudo 3D Courtesy www.ian-ko.com/resources/triangulated_irregular_network.htm
Spatial Autocorrelation Tobler’s 1st Law of Geography:everything is related to everything else, but near things are more related than distant things S. autocorrelation: formal property that measures the degree to which near and distant things are related. Close in space Dissimilar in attributes Attributes independent of location Close in space Similar in attributes Arrangements of dark and light colored cells exhibiting negative, zero, and positive spatial autocorrelation.
Sampling: The Quest to Represent the Real World Field - selecting discrete objects from a continuous surface Object - selecting some discrete objects, discarding others a sampling scheme with periodic random changes in the grid width of a spatially systematic sample a spatially random sample a stratified random sample a spatially systematic (stratified) sample Spatially systematic sampling presumes that each observation is of equal importance in building a representation.
Spatial Interpolation:“Intelligent Guesswork” • the process of filling in the gaps between sample observations. • attenuating effect of distance between sample observations • selection of an appropriate interpolation function • Tobler’s law - nearer things are key, in a smooth, continuous fashion • Pollution from an oil spill • Noise from an airport, etc.
(Artificial) Smooth & Continuous Variation:contours equally spaced, along points of equal elevation
Is Variation in Nature Always Smooth and Continuous? Graduate Student’s Corollary to Tobler’s 1st Law of Geography • “The real world is infinitely complex, so why bother?” • For true nature of geographic data, use other interpolation methods and functions • IDW - nearer points given more importance • Sampling still important!!!
Same IDW Interpolation( but higher elevations skewed to right )