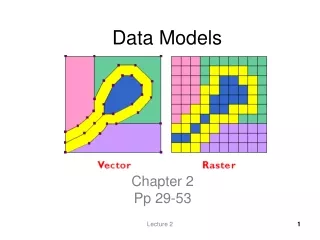
Geographic Data Models
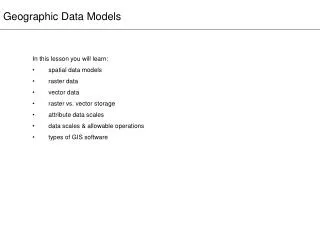
Geographic Data Models. In this lesson you will learn: spatial data models raster data vector data raster vs. vector storage attribute data scales data scales & allowable operations types of GIS software. From features to data.

Geographic Data Models
E N D
Presentation Transcript
Geographic Data Models • In this lesson you will learn: • spatial data models • raster data • vector data • raster vs. vector storage • attribute data scales • data scales & allowable operations • types of GIS software
From features to data “We would never have learned anything if we had never thought: This object resembles this other, and I expect it to manifest the same properties.” -Bertrand de Jouvenel Quoted in: R. Abler, J. Adams, and P. Gould, Spatial Organization: The Geographer’s View of the World, Englewood Cliffs, NJ: Prentice-Hall, 1971.
The spatial data model • Definition: a data model is a logical means of organization of data for use in an information system • -from: K.C. Clarke, Getting Started with Geographic Information • Systems, 2nd edn., Upper Saddle River, NJ: Prentice Hall, 1999.
“green” separate “blue” separate Basic data models 1: raster source: U.S. Geological Survey, Topographic Mapping, http://erg.usgs.gov/isb/pubs/booklets/topo/topo.html
Resolution, scalability and quality point object line object low resolution high resolution
(x1, y1) “Raster is faster, … • Raster meta-data • image projection • data image size : # columns, # rows • pixel size • geographic coordinates of first (NW corner) and last pixel (SE corner) Raster data can be generalized and simplified, but they cannot be reprojected.
… but raster is vaster” Quadtree structured raster data
Basic data models 2: vector Hierarchical geometry of the vector data model
Vector points, lines, polygons (xto,yto) (xfrom,yfrom)
Point data file Vector data storage Line data file Polygon data file
Resolution, scalability and quality Vector data are infinitely scalable, with resolution only up to the precision of the coordinate measurements 1:24,000 1:12,000 1:6,000
Mixing data models source: Northern Illinois University, Department of Geography, GIS Lab
Mixing data models Demonstration 3-d shaded relief image; portion of Carroll County, Illinois. Courtesy of the Advanced Geospatial Lab, Department of Geography, Northern Illinois University
Data scales and allowable operations eye color: brown; blue; gray; hazel; green; other nominal scale land use: commercial, industrial; residential; open space; other class standing: freshman, sophomore, junior, postgraduate ordinal scale residential density: low, medium, high
Data scales and allowable operations interval scale ratio scale
Types of GIS software • Raster GIS: designed and programmed for raster spatial databases; strengths in image • processing, including image conflation and extraction; may include ability to use and • create vector data and perform elementary vector operations • Vector GIS: designed and programmed for vector spatial databases; strengths in feature • geometry and feature-based spatial analysis, such as buffering, distance, and density • analyses; can incorporate feature topology for advanced analysis; may include ability to • use and create raster data for depiction of surfaces and graphic output • Web GIS: host may use raster or vector data; raster or vector-standard output to client ensures universal/multi-platform access and faster graphics rendering; analyses and spatial operations more limited than desktop/server implementation.
Spatial data vs. Mapping data “color” separates Printed USGS topographic map blue green brown purple black red source: U.S. Geological Survey; www.usgs.gov
GIS vs. Mapping vs. CAD GIS map CAD map graphics illustration map
CAD to GIS GIS to graphics CAD graphics & attribute data GIS map geo- coordinates reference graphics converter GIS project ? ü graphics illustration GIS vs. Mapping vs. CAD
In this lesson you have learned: • Spatial data are organized by feature class, with each object in a feature class having the same basic characteristics – including geometry. • A data model is a means for organizing and structuring the data used in an information system. • Geographic Information Systems employ two basic types of spatial data models: raster and vector. • The raster data model is composed of pixels. Pixels either belong to a feature or are empty. Raster data are easily rendered to screen or output, have an inherent scale resolution and projection, but are not reprojectable. • The vector data model reduces object geometry to the locational coordinates of vertices. Faces of a surface can be reduced to polygons, perimeters of polygons to edges, and edges or line segments to sets of from- and to-vertices. Vertices are point data describable by location coordinates. Vector data are infinitely scalable and reprojectable, but require additional processing to render to screen or output. • No data model is ideal for all purposes: the raster model is best suited to images and where features extensively cover geographic space; the vector model separates individual features from the background and best captures the geometry of features. • The measurement scale of attribute data determines the types of mathematical or statistical operations that can be performed with those data. Nominal and ordinal scales are qualitative; interval and ratio scales are quantitative. • Common color models for imagery are panchromatic and RGB; one brightness value is associated with each dimension of the color model for each pixel. Brightness data are interval-scaled, with values that range between 0 and 255. • GIS may be referred to as raster or vector GIS, though most software is capable of using either type of data. Web GIS outputs raster data to the client, enabling quicker rendering across multiple platforms. • Map data created in CAD and illustration software are graphics data. GIS, CAD and illustration software have similar graphics functions; GIS can input CAD data and output maps to illustration software. What you have learned: