Blank Bode Amplitude Plot
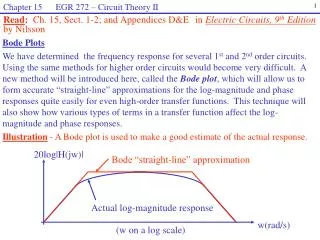
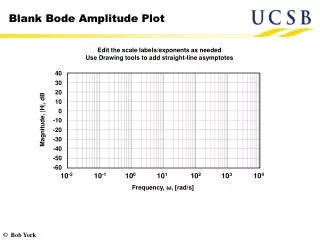
Blank Bode Amplitude Plot. Edit the scale labels/exponents as needed Use Drawing tools to add straight-line asymptotes. 40. 30. 20. 10. 0. Magnitude, |H|, dB. -10. -20. -30. -40. -50. -60. 10 -2. 10 -1. 10 0. 10 1. 10 2. 10 3. 10 4. Frequency, ω , [rad/s].

Blank Bode Amplitude Plot
E N D
Presentation Transcript
Blank Bode Amplitude Plot Edit the scale labels/exponents as needed Use Drawing tools to add straight-line asymptotes 40 30 20 10 0 Magnitude, |H|, dB -10 -20 -30 -40 -50 -60 10-2 10-1 100 101 102 103 104 Frequency, ω, [rad/s]
Example Uncorrected Amplitude Plot 40 30 20 10 0 Magnitude, |H|, dB -10 -20 -30 -40 -50 -60 10-2 10-1 100 101 102 103 104 Frequency, ω, [rad/s]
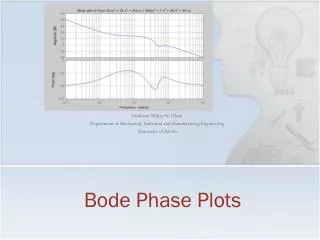
Blank Bode Phase Plot Edit the scale labels/exponents as needed Use Drawing tools to add straight-line asymptotes 40 30 20 10 0 Phase, H, degrees -10 -20 -30 -40 -50 -60 10-2 10-1 100 101 102 103 104 Frequency, ω, [rad/s]