Download
1 / 11
280 likes | 784 Views
1. Thermodynamics: Phase Diagrams. 2. What is a phase diagram?. A phase diagram is common way to represent the various phases of a substance and the conditions under which each phase exists.

E N D
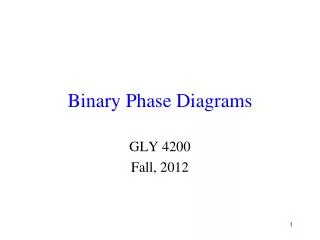
1 Thermodynamics: Phase Diagrams
2 What is a phase diagram? • A phase diagramis common way to represent the various phases of a substance and the conditions under which each phase exists. • A phase diagram is a plot of pressure (P) vs temperature (T). Lines on the diagram represent conditions (T,P) under which a phase change is at equilibrium. That is, at a point on a line, it is possible for two (or three) phases to coexist at equilibrium. In other regions of the plot, only one phase exists at equilibrium. • Triple PointAt the triple-point temperature, T3, and triple-point pressure, P3, three phases can coexist at equilibrium. The point at T3, P3 is called the triple point. • Critical PointAt a temperature above the critical temperature, Tc, and a pressure above the critical pressure, Pc, it is no longer possible to distinguish between the gas and liquid phases. At T > Tc and P > Pc the substance is referred to as a super-critical fluid. • http://www.chm.davidson.edu/vce/phasechanges/PhaseDiagram.html
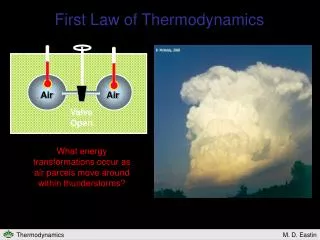
What is this equilibrium of which you speak? • Equilibrium is a condition where two reversible processes are occurring at the same rate so that there is no net change. • The states of matter can exist at equilibrium when: • Rate of freezing = rate of melting • Rate of boiling = rate of condensing • Rate of sublimation = rate of deposition • At the triple point, all of the rates listed above are happening at the same time!
Example: CO2 4 http://www.teamonslaught.fsnet.co.uk/co2%20phase%20diagram.GIF
What is “normal”? • Sometimes you’ll see freezing point and boiling point referred to as the normal freezing point or normal boiling point. • The word “normal” means that the phase change is occurring at standard pressure (1 atm). • Technically, f.p and b.p. are both a temperature AND pressure (points on a graph have two coordinates) • But we usually refer to the freezing point of water as 0°C and the boiling point of water as 100°C • These are actually the normal f.p. and b.p. because they’re happening at standard atmospheric pressure so pressure isn’t specified
Example: Water 6 http://serc.carleton.edu/images/research_education/equilibria/h2o_phase_diagram_-_color.v2.jpg
Example: UF6 7 http://web.ead.anl.gov/uranium/guide/prodhand/images/DUF6PH22.gif
Example: Carbon 8 http://dao.mit.edu/8.231/carbon_phase_diagram.jpg
Example: Silica 9 http://www.quartzpage.de/cr/silica_phase_diagram.png
Did you notice…? 10 • Some substances had more than three “states” of matter! • The extra “states” are not truly states of matter, they are allotropic forms of the same substance. • Allotrope: a different bonding structure of the same compound or element • Example: carbon as graphite v. carbon as diamond • Both are solid forms of carbon!
One other thing… 11 • Solid lines represent two phases at equilibrium • So any time you cross a line, a phase change has occurred • And that, my friends, is that.