Download
1 / 17
180 likes | 347 Views
Phase Diagrams & Heating Curves. sublimation. melting. evaporation. freezing. condensation. deposition. Phases…. phase -a system that is chemically and physically uniform throughout

E N D
sublimation melting evaporation freezing condensation deposition
Phases…. • phase-a system that is chemically and physically uniform throughout • phase diagram-shows information on all three phases in relation to temperature and pressure
Key Places on a Phase Diagram • Triple point: the spot at which all three phases exist at equilibrium • Critical Temperature (Tc): temperature above which it’s impossible to liquefy a substance • Critical Pressure (Pc): pressure that corresponds to the “critical point” on the diagram • Critical Point (CP): marks the intersection between the Pc and Tc.
Key Places on a Phase Diagram • x-axis: represents the temperature • y-axis: represents the pressure • Normal Boiling Point: the temperature which causes the vapor pressure to become equal to the normal pressure • Normal Melting Point: the temperature which the normal pressure hits the solid and liquid line
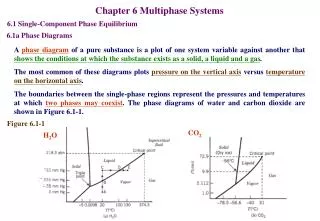
Label the Phase Diagram for Water • x-axis (temperature) • y-axis (pressure) • Tc • Pc • CP • triple point • boiling point (BP) • melting point (MP)
Questions… • What state is this substance in at a pressure of .75 atm and a temperature of .005°C? • At what temperature do all three states exist in equilibrium? • At 100 atm, this substance spends most of its time in what phase? • What can you say about the slope of the solid/liquid line on this diagram?
Questions… • What state is this substance in at a pressure of .75 atm and a temperature of .005°C? • solid • At what temperature do all three states exist in equilibrium? • .01˚C • At 100 atm, this substance spends most of its time in what phase? • liquid • What can you say about the slope of the solid/liquid line on this diagram? • decreases/negative
Label the Phase Diagram for CO2 • x-axis (temperature) • y-axis (pressure) • Tc • Pc • CP • triple point • boiling point (BP) • melting point (MP)
Questions… • What is the b.p. and m.p. for CO2? • What is the temperature and pressure at the critical point? • At a pressure of 1 atm and a temperature of -10.0°C, what phase is CO2? • What can you say about the slope of the solid/liquid line on this diagram? • Why is there a difference in the slope of water and most other substances?
Questions… • What is the b.p. and m.p. for CO2? • There isn’t a m.p. or b.p. • What is the temperature and pressure at the critical point? • 31.1˚C and 73 atm • At a pressure of 1 atm and a temperature of -10.0°C, what phase is CO2? • gas • What can you say about the slope of the solid/liquid line on this diagram? • positive • Why is there a difference in the slope of water and most other substances? • Ice has a lower density than water, while other substances have much denser solids.
Heating Curves • Water will go through several different changes as it is heated. • A heating curve relates time and temperature. • IMPORTANT: During a phase change the temperature DOES NOT change.
5 Processes in a Heating Curve • Substance starts as solid. Initial heat is added to raise the temp to O˚C. The atoms vibrate faster, but NO bonds are broken. 2. Ice reaches O˚C. Atoms move so fast that bonds are broken and melting occurs. The temperature does not change. All the energy goes into breaking bonds. 3. Additional heat moves the particles faster and will increase the heat up to 100˚C. Bonds are not broken.
5 Processes in a Heating Curve 4. Liquid reaches 100˚C and more bonds are broken. This phase change is called boiling. Does the temperature change? All the energy is breaking what? 5. As more heat is added the temperature continues to rise. Atoms move really really fast and continue to produce steam.