Download

1 / 46
630 likes | 1.85k Views
Phase Diagrams. A phase is a state of matter with the following characteristics: It has the same structure or atomic arrangement throughout It has roughly the same composition and properties throughout.

E N D
Phase Diagrams A phase is a state of matter with the following characteristics: • It has the same structure or atomic arrangement throughout • It has roughly the same composition and properties throughout. • There exists a definite interface between it and its surroundings or adjoining phases.
Phase Diagrams A phase diagram is a graphical representation of the phases that are present in a material at various temperatures and pressures and compositions. • It usually describes the equilibrium conditions • Sometimes non-equilibrium conditions are also shown when well known.
Phase Diagram • It indicates the melting/solidification temperatures of the constituents • It indicates the compositions of alloys where solidification begins and the temperature range over which it occurs. For a pure substance, the Pressure-Temperature phase diagram simply tells which forms (solid, liquid, gas) of the material exist under different P-T conditions. Phase diagram for magnesium, showing the melting and boiling temperatures at one atmosphere pressure. Phase diagram for water.
General Types of Phase Diagrams There are two general types of alloys having phase diagrams. • Substitutional alloys • Interstitial alloys Subtitutional alloys have elements, which are incorporated into regular lattice positions within the unit cell. An example is Tin and Zinc alloying additions to Copper to form bronze and brass, respectively Interstitial alloys have elements, which are incorporated into the interstitial sites of the unit cell. An example is carbon in iron to form steel.
Gibb’s Phase Rule Gibb’s phase rule describes the thermodynamic state of a material. This famous rule is used to determine the number of phases that can coexist in equilibrium in a given system. It has the general form: F = C – P + 2 C is the number of components, usually elements or compounds, in the system. F is the number of degrees of freedom, or number of variables, such as temperature, pressure, or composition that are allowed to change independently without changing the number of phases in equilibrium. P is the number of phases present The constant “2” in the equation implies that both temperature and pressure are allowed to change.
Gibb’s Phase Rule For the triple point of water: • One component, i.e., water. • 3 phases present, i.e. vapor, liquid, and solid. • F = 1 – 3 + 2 = 0, so this is an invariant point on the diagram Most binary phase diagrams used in materials science are temperature and composition diagrams at a constant 1 atmosphere of pressure. The constant pressure will reduce the degrees of freedom from “2” in Gibb’s equation to “1” for a binary phase diagram Thus, F = C – P + 1.
Liquidus/Solidus Temperatures The liquidus temperature is the temperature above which a material is completely liquid. The solidus temperature is the temperature which the alloy is 100% solid. The freezing range of the alloy is the temperature difference between the liquidus and solidus where the two phases exists, ie., the liquid and solid. The cooling curve for an isomorphous alloy during solidification. The changes in slope of the cooling curve indicate the liquidus and solidus temperatures. This is the Mech 285 Solidification Lab.
Tie Line A binary phase diagram between two elements A and B. When an alloy is present in a two phase region, a tie line at the temperature of interest fixes the composition of the two phases. This is a consequence of the Gibbs phase rule, which provides for only one degree of freedom.
Lever Rule The Lever Rule is used to calculate the weight % of the phase in any two-phase region of the Phase diagram (and only the two phase region!) In general: • Phase percent = opposite arm of lever x 100 total length of the tie line For example,
Lever Rule When a material solidifies it does not have a constant concentration throughout the material but there will be concentration gradients, which will significantly alter the properties of the material. This is an important concept. In the example of Cu and Ni, the concentration of Ni that freezes at 1270 oC is 50 wt%, at 1250 oC is 45 wt% and 1200 oC is 40 wt%.
Lever Rule Calculate the amount of a phase and L phase present in a Cu - 40% Ni alloy at 1250 C In general: • Percent a phase = (% Ni in alloy) – (% Ni in L) x 100 % Ni in L - % Ni in a
Solidification of a Solid-Solution Alloy The change in structure and composition of a Cu-40% Ni alloy during equilibrium solidification showing that the liquid contains 40% Ni and the first solid contains Cu-52% Ni. At 1250 C, solidification has advanced and the phase diagram tells us that the liquid contains 32% Ni and the solid contains 45% Ni, which continues until just below the solidus, all of the solid contains 40% Ni, which is achieved through diffusion.
Nonequilibrium Solidification and Segregation When cooling is too fast for atoms to diffuse and produce equilibrium conditions, nonequilibriumconcentrations are produced. The first solid formed contains 52% Ni and the last solid only 25% Ni with the last liquid containing only 17% Ni. The average composition of Ni is 40% but it is not uniform.
Microsegregation and Homogenization The nonuniform composition produced by nonequilibrium solidification is known as segregation. Microsegregation, also known as interdendritic segregation and coring, occurs over short distances on the micron length scale. Microsegregation can cause hot shortness which is the melting of the material below the melting point of the equilibrium solidus. Homogenization, which involves heating the material just below the non-equilibrium solidus and holding it there for a few hours, reduces the microsegregation by enabling diffusion to bring the composition back to equilibrium.
Microsegregation and Homogenization Macrosegregation can also exist where there exist a large composition difference between the surface and the center of a casting, which cannot be affected by diffusion as the distance is too large. Hot working breaks down the cast macrostructure enabling the composition to be evened out.
Phase Diagrams with Intermediate Phases and Compounds Many combinations of two elements produce more complicated phase diagrams than the isomorphous systems and the simple eutectic systems. • Many equilibrium diagrams often show intermediate phases and compounds when either incomplete solubility or compound formation occurs. • These new phases are distinguished by the labels “terminal phases” and “intermediate phases”. • Their phase diagrams look complex.
Phase Diagrams with Intermediate Phases and Compounds • The terminal solid-solution phases occur at the ends of the phase diagrams, bordering on the pure components, e.g., the alpha phase and the beta phase in the Pb-Sn phase diagram. • Intermediate phases commonly have new compounds and are called intermediate compounds or intermetallic compounds. • An intermediate compound is made up of two or more elements that produce a new phase with its owncomposition, crystal structure, and properties. • Intermediate compounds are almost always veryhard and brittle. • An example is Fe3C in steels.
Non-stoichiometric intermetallic compounds • These have a range of compositions and are often called intermediate solid solutions. • An example is the iron-chrome alloy. • The 50/50 composition orders at temperatures below ~900 oC to form the s –phase, which causes embrittlement in stainless steels. Intermetallic Compounds
Stoichiometric intermetallic compounds • These have a fixed composition such as iron carbide (Fe3C). • On the phase diagram they are represented by a straight line. Intermetallic Compounds The aluminum-antimony (AlSb) phase diagram includes a stoichiometric intermetallic compound, g.
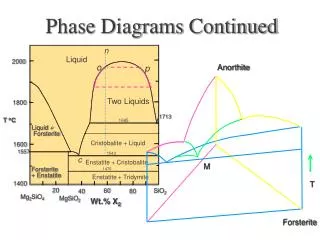
Phase Diagrams Containing Three-Phase Reactions In more complex phase diagrams, the type of melting is sometimes used to describe the type of intermediate compound that occurs along with a particular type of solid state reaction. • Congruently melting compounds are those that maintain their specific composition right up to the melting point. This appears as a localized “dome” in the liquidus region of the phase diagram. • Incongruent melting compounds do not occur directly from the liquidus, but are formed by some form of solid-state reaction. The five most important three-phase reactions that occur in phase diagrams are: • Eutectic – a liquid transforms into two solids upon cooling • Eutectoid – a solid transforms into two new solids • Peritectic – a liquid plus a solid transforms into a new solid • Peritectoid – two solids transforms into a new solid • Monotectic – a liquid transforms into a new liquid and a solid.
Three phase reaction type, reaction equation and appearance on a phase diagram.
Locate a horizontal line on the phase diagram. The horizontal line, which indicates the presence of a three-phase reaction, represents the temperature at which the reaction occurs under equilibrium conditions. Rules of Three Phase Reactions
Locate three distinct points on the horizontal line: the two end points plus a third point, often near the center of the horizontal line. The center point represents the composition at which the three-phase reaction occurs. Rules of Three Phase Reactions
Rules of Three Phase Reactions • Write in the reaction from the phase(s) above the center point transforming to the phase(s) below the point. In most cases the reaction will be a eutectic, eutectoid, peritectic, etc.
A • Many alloy systems are based on three or moreelements. • To describe the changes in structure with temperature, a three-dimensional phase diagram is required, which is somewhat complicated. • In the plot below the shaded area is the temperature at which freezing begins. Ternary Phase Diagrams Hypothetical ternary phase diagrams where binary phase diagrams are present at the three faces.
A • To reduce the complexity of the plot, we can hold the temperature constant to make a isothermal plot or hold the phase transformation constant such as the liquidus and show its temperature dependence. Ternary Phase Diagrams Hypothetical ternary phase diagrams where binary phase diagrams are present at the three faces.
In a liquidus plot, the freezing/melting temperatures for each composition are plotted onto a triangular diagram. • This presentation is helpful in predicting the melting/freezing temperature of the alloys. • And, the plot includes the primary phases that form during solidification for any given composition. Ternary Phase Diagrams A liquidus plot for the hypothetical ternary phase diagram.
Ternary Phase Diagrams • The isothermal plot of a ternary phase diagram is usually constructed using an equilateral triangle with the composition of each pure element (or compound) at each corner of the triangle to predict the phases at a particular temperature. An isothermal plot at room temperature for the hypothetical ternary phase diagram.
Nomenclature: • Phase • Component • Phase diagram • Liquidus • Solidus • Solvus Basic Information on a Phase Diagram • Equilibrium phase(s) as a function of temperature and composition • Equilibrium composition of each phase • Relative amount of each phase in a two phase region • Reactions during heating and cooling Summary of Vocabulary
Summary of Vocabulary Important Rules • Phase rule: F + P = C + 2 • Lever rule: XA = (Wo – WB)/(WA – WB)
The End (Any questions or comments?)
Isomorphous Phase Diagrams A phase diagram shows the phases and their compositions at any combination of temperature and alloy composition When only two elements or two compounds are present in a material a “binary phase diagram” can be constructed. In isomorphous binary phase diagrams only one solid phase forms as the two components in the system display complete solid solubility. Examples include the Cu-Ni and NiO-MgO systems. Note that the concentrations can be expressed in wt% or mole %.
Rapidly Solidified Powders Many complex metal alloys are made by rapidly solidifying a spray of fine droplets of material, usually consisting of complex compositions, in a quenching gas such as argon, nitrogen or water. Examples are nickel- and cobalt-based super alloys and some stainless steels. This process minimizes microsegregation, macrosegregation and porosity since the process happens so rapidly that there is no time for segregation or diffusion. The fine particles are then processed into shapes using sintering, hot pressing and hot isostatic pressing(HIP).
Properties and Applications of Intermetallics • Intermetallics such as Ti3Al and Ni3Al have an ordered crystal structure where the Ti and Al atoms occupy specific locations in the crystal rather than random locations as in most solid solutions. • In TiAl the Ti atoms are located at the corner and the top and bottom faces of the unit cell whereas Al atoms are only at the other four faces of the unit cell. • This ordered structure makes it difficult for dislocations to move, which results in poor ductility at low temperatures, which increases at high temperatures. • TiAl also has a high activation energy for diffusion, giving good creep resistance at elevated temperatures. Intermetallic Compounds The unit cell of two intermetallic compounds: a) TiAl has an ordered tetragonal structure and b) Ni3Al has an ordered cubic structure.
Many alloy systems are based on only two elements. • A good example is the lead-tin system, which is used for soldering but because of the toxicity of Pb, it is now being replaced with other Sn alloys. Solid Solution Alloys • A single phase solid solution forms during solidification. • Examples include Pb-2 wt% Sn. • These alloys strengthen by solid-solution strengthening, by strain hardening and by controlling the solidification process to refine the grain structure. Eutectic Phase Diagrams Solidification and microstructure of Pb-Sn alloy showing single-phase solid solution at 2 wt%.
Alloys that exceed the solubility limit • Pb-Sn alloys between 2% - 29% Sn also solidify to produce a single solid solution, however, as the solid-state reaction continues, a second solid phase, b, precipitates from the a phase. • The solubility of Sn in solid Pb at any temperature is given by the solvuscurve. We’ll see later how this is important for age hardening materials. • Any alloy containing between 2% and 19% Sn that cools past the solvus exceeds the solubility resulting in the precipitation of the b phase. Eutectic Phase Diagrams Solidificaton, precipitation and microstructure of Pb-10%Sn alloy. Some dispersion strengthening occurs as the b solid precipitates.
Eutectic Phase Diagrams Alloys that exceed the solubility limit • The Pb – 61.9% Sn alloy has the eutectic composition. • The eutectic composition has the lowest melting temperature. • The eutectic composition has no freezing range as solidification occurs at one temperature (183 C in the Pb-Sn alloy). • The Pb-Sn eutectic reaction forms two solid solutions and is given by: L61.9% Sna19% Sn + b97.5% Sn • The compositions are given by the ends of the eutectic line. Solidificaton and microstructure of eutectic alloy of Pb-61.9%Sn. Often eutectic alloys have a special microstructure as shown.
Eutectic Phase Diagrams a) Atom redistribution during lamellar growth of a Pb-Sn eutectic. Sn atoms from the liquid preferentially diffuse to the b plates, and Pb atoms diffuse to the a plates. b) photograph of the Pb-Sn eutectic. Cooling curve for a eutectic alloy is a simple thermal arrest, since eutectics freeze or melt at a single temperature. Review example 11-4 in Askeland and Phule, which shows you how to calculate the amount and composition of eutectic phases.
Eutectic Phase Diagrams Hypoeutectic alloy • This is an alloy whose composition will be between the left-hand-sideof the end of the tie line and the eutectic composition. • For the Pb-Sn alloy, it is between 19% and 61.9% Sn. • In the hypoeutectic alloy, the liquid solidifies at the liquidus temperature producing solid, a and is completed by going through the eutectic reaction. Solidificaton and microstructure of a hypoeutectic alloy of Pb-30%Sn.
Hypereutectic alloy • This is an alloy whose composition will be between the right-hand-side of the end of the tie line and the eutectic composition. • For the Pb-Sn alloy, it is between 61.9% and 97.5% Sn. • The primary or proeutectic solid that forms the b phase before the eutectic phase is different from the eutectic solid and leads to a variation in microstructure. Eutectic Phase Diagrams a) A hypereutectic alloy of Pb-Sn and b) a hypoeutectic alloy of Pb-Sn where the dark constituent is the Pb-rich a phase and the light constituent is the Sn-rich b phase and the fine plate structure is the eutectic..
Each phase in the eutectic can be solid-solution strengthened since increasing the alloying addition to the phase increases its strength. Some eutectics can be strengthened by cold working. Adding grain refiners, or inoculants, during solidification can decrease grain size. The amount and microstructure of the eutectic can also be controlled. • Each eutectic colony can nucleate and grow independently having the orientation of the lamellae being identical. • The lamellae orientation changes on crossing from one colony boundary to another. • By refining the colony size by inoculation, the strength can be improved. • The eutectic is strengthened by decreasing the interlamellar spacing. Strength of Eutectic Alloys Colonies in the Pb-Sn eutectic and the effect of growth rate, R, on the interlamellar spacing, l, in the eutectic, which follows the relationship: Growth rate (cm/s)
Strength of Eutectic Alloys Interlamellar spacing This is the distance between the center of one a lamella to the center of the next a lamella. A small interlamellar spacing indicates that the amount of a binterface area is large. A small interlamellar spacing therefore increases the strength of the eutectic. The interlamellar spacing in a eutectic microstructure.
Not all eutectics give a lamellar structure. The morphology of the two phases depends on the cooling rate, presence of impurities, and the nature of the alloy. An example is a Al-Si alloy where the Si portion of the eutectic grows as thin platelets (much have a high surface interface energy) growing as thin, flat platelets, which concentrate stresses leading to reduced ductility and toughness. Modification causes the Si phase to grow as thin, interconnected rods between dendrites of Al, which increases strength and elongation. Microstructure of Eutectic Alloys Typical eutectic microstructures of Al-Si where a) shows needle-like plates and b) shows a modified structure of rounded rods, which are difficult to see in this micrograph.
If the alloys cools too quickly, a non-equilibrium solidus curve is produced. Example, for a Pb-15%Sn alloy, the a phase should freeze at 230 C, which is well above the eutectic temperature of 183 C. As the a phase continues to grow until, just above 183 C, the remaining non-equilibrium liquid contains 61.9 %Sn, the eutectic composition. This liquid then transforms to the eutectic microconstituent, surrounding the primary alpha phase. For the conditions shown in the figure below, the amount of eutectic is: Non-equilibrium Solidification of Eutectic Alloys At near equilibrium conditions, 100% a phase should form. For non-equilibrium solidification a microstructure of a phase and a eutectic microconstituent form if the solidification is too rapid.