Download
1 / 35
390 likes | 612 Views
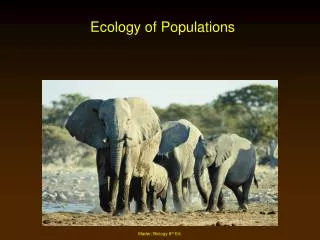
Populations & Population Growth Bio1 2013. What makes a population size change?. How could a pop grow in size? Increase births Decrease deaths Increase Imm. Decrease Emig. Births Deaths Immigration (Entering) Emigration (Leaving). How can we study population growth?.

E N D
What makes a population size change? How could a pop grow in size? Increase births Decrease deaths Increase Imm. Decrease Emig. • Births • Deaths • Immigration (Entering) • Emigration (Leaving)
How can we study population growth? • Create a model. • The simplest model assumes that people/organisms aren’t entering or leaving. • In this case growth rate (the speed of an increase or decrease in population size) depends only upon births and deaths.
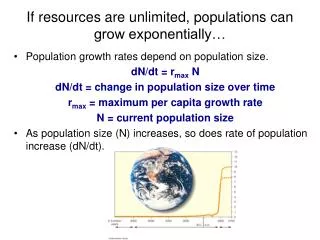
Model #1: No Limits to growth(aka Exponential Growth) • Represented by the formula: G=rN • Where, G = the change in population size (the Growth Rate) N = number of individuals in the population r = the intrinsic (built-in) rate of increase for a species; r = the birth rate minus the death rate for a species • So the Change in Population Size (G), is equal to the Number of individuals you start with (N), times the Intrinsic Rate of Increase (r).
Model #1: No limits to growth This idealized growth model is called Exponential Growth • Under ideal conditions pops usually can grow quickly. • The larger the pop, the faster it can grow. Why? • Because there are more orgs reproducing (But this doesn’t typically happen in natural pops for long...Why?) Time
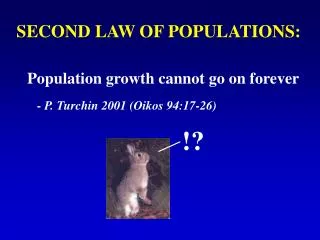
Let’s calculate… • If you were to start with two rabbits of opposite sex, how many rabbits would you have after 20 generations? • 220 = ?
After 20 generations… • You’d have 1,048,576 rabbits • And a rabbit’s gestational period is only 29 days… • So in less than 2 years you’d be up to your eyeballs in bunnies if the population grew unchecked!
Model #2: Limits to growth(aka Logistic Growth) • Limiting factors often involve running out of resources. • Not enough clean water • Not enough food • Not enough space • In addition to competition for resources, the spread of disease may increase as a pop grows.
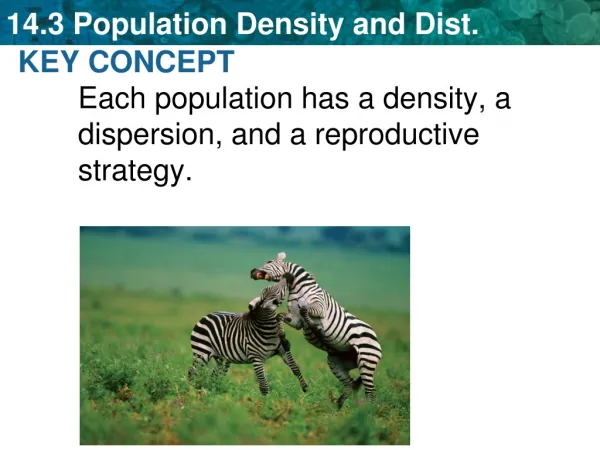
Logistic Growth & Carrying Capacity Carryingcapacity • The number of organisms where this curve maxes out and levels off is called the carrying capacity (K) • K represents the max # of individuals that a given environment can support • Logistic Growth equation: G = rN (K-N) K • What happens in this equation when N is small? • When N is growing? • When N approaches K? • When N=K? • Where is G maximized? N Assumer=1 and K=100 If N=1, G = 1×1(100-1) = 99 ≈ 1 100100 If N=50, G = 1×50(100-50) = 50 (½) = 25 100 If N=75, G = 1×75(100-75) = 75 (¼) ≈ 19 100 If N=100, G = 1×100(0) = 0 When N = ½K or K/2 Where is slope greatest?
Population Limiting Factors greater • Density-Dependent Limiting Factors: Affect ________ % of a pop. as it grows and increases in density. • Competition • Predation: hare & lynx example • Parasitism / Disease • Density-Independent Limiting Factors: Affect ________ % of pop. regardless of density (can affect small scattered pops as well as large crowded ones). • Extreme weather / natural disasters • Frost / freezing temps, floods, lava flow • Fire • Pollution/Human Activities • Heavy pesticide use, clear-cut logging, strip mining same
Predator-Prey Interactions: Lynx & Hare http://www.sciencesource2.ca/images/quiz_harelynxgraph.jpg What do you notice about the rise & fall of the lynx population, compared to the hare population? Why does this happen?
Predator-Prey Interactions http://whyevolutionistrue.wordpress.com/2010/07/31/caturday-felid-the-missing-lynx/
Exponential growth followed by a population crash:Boom-Bust pattern • At what pop size do you think this pop reached its carrying capacity for this environment? • Why did this pop “boom”? • Why did it then “bust”? • Effect on carrying capacity?
Population Success Strategies • When considering population dynamics, it is important to realize that not all species have the same strategy for continuing their species... • Some species are successful by being very good at reproducing. • Other species are successful by being very good at surviving. • Some are equally mediocre at these two things. • These differences contribute to very different life history patterns for different species.
Good Survivors exhibit an Equilibrial Life History Good Survivors usually: • grow slowly and reach sexual maturity later in life • have only a few offspring at a time (small brood size) • invest a great deal of energy in raising their young • have longer life spans • maintain pop. size near carrying capacity (no big ups & downs) If an organism reproduces slowly, it’s population is more likely to slow in growth as it reaches (and stabilizes at) its carrying capacity (thus reaching an equilibrium). http://img6.travelblog.org/Photos/58143/248570/t/2154129-19-0.jpg Examplesusually include: humans, primates, elephants…coconut palms
Good Reproducers have an Opportunistic Life History • Good reproducers usually: • growquickly and reach sexual maturity quickly • have shorter life span • have small body size • make tons of babies (not all of which survive to adulthood) • hope for the best – they typically provide almost no parental care. • Their populations have the capacity to grow exponentially and then crash. Other examples: Frogs often lay thousands of eggs, only a fraction of which survive through the tadpole and juvenile stages to adulthood. insects, many fish, and dandelions
Survivorship Curves can show the range of life history patterns Mammals such as humans that produce few offspring with good parental care exhibit Type I survivorship with low death rates during early and middle life. Organisms such as oysters and various insects, that produce many offspring with little or no care, exhibit Type III survivorship with high death rates of young. Type II curves are intermediate, with a constant death rate over the organism’s life span, as with songbirds and squirrels.
Who cares about survivorship curves anyways?!? They are sooooo important! • Can be used in planning for: • life insurance • health care • retirement plans / pensions
HumanPopulationGrowth http://www.poodwaddle.com/clocks/worldclock http://galen.metapath.org/popclk.html
Human population growth • Human population was low and stable for a LONG time. Why? • How could the population rapidly skyrocket the way it has in the past 200 years? _________________________________________ • Which of these is mainly responsible? Incr birth rate, Decr death rate, or Both ? Due to incr food prod, improved sanitation, & medical advances
Human Population Size Throughout History Major scientific and medical advances Industrial Revolution begins Bubonic plague “Black death”
Human Population Growth • Birthrates, deathrates, and the age structure of a population help predict growth rates in different countries. • The statistics that describe the characteristics of a population (like birthrate and deathrate) are called demographics.
The Demographic Transition: A sequence of demographic changes in which a country moves from high birth and death rates (stage 1) to low birth and death rates (stage 4) through time. This typically happens as a country develops from a pre-industrial to an industrialized economic system.
The Demographic Transition Explained http://coolgeography.co.uk/A-level/AQA/Year%2012/Population/DTM/DTM%20new.htm
Age Structure Diagrams also tell us about a population’s characteristics
Age Structure Diagrams allow us to predict the future of a population
Comparing different age structure diagrams (Denmark, Italy) (Germany, Japan) (Kenya, Nigeria, Mexico) (US, Canada)
The BIG questions are… • What is the Earth’s carrying capacity? • Have we surpassed it and are preparing for a population crash? • Are we near it and will exceed it if the current rate of growth continues? • Are we far from the carrying capacity and should therefore not be concerned about population growth?
Estimating Earth’s carrying capacity for humans is a complex problem • Predictions of the size of the human population vary from 7.3 to 10.7 billion people by the year 2050. • Will the earth be overpopulated by this time? • What is the carrying capacity of Earth for humans? • This question is difficult to answer… • There are a wide range of estimates for the Earth’s carrying capacity for humans • Estimates are usually based on food availability, but these estimates limited by the assumptions required about amount of available farmland, average yield of crops, most common diet (vegetarian or meat eating), and number of calories provided to each person each day.
Ecological footprint: a measure of human demand on the Earth's ecosystems. • Humans have multiple constraints besides food. • The concept an of an ecological footprint uses the idea of multiple constraints on the human population, not just food availability, to measure a population’s resource use. • Six types of ecologically productive areas are used in calculating the ecological footprint: • Land suitable for crops. • Pasture (land used for grazing animals). • Forest. • Ocean. • Built-up land. • Fossil energy land.
What does it the red line represent? What does it mean to be “above the line”? How about “below the line”? The ecological footprints for 13 countries, as compared to their available ecological capacity Note: 1 hectare (ha) = 2.47 acres
A Summary of the (human) World • If we could, at this time, shrink the Earth's population to a village of precisely 100 people, with all existing human ratios remaining the same, it would look like this: • There would be 57 Asians, 21 Europeans, 14 from the Western Hemisphere (North and South) and 8 Africans. • 70 would be nonwhite; 30 white. • 70 would be non-Christian; 30 Christian. • 50% of the entire world's wealth would be in the hands of only 6 people. • All 6 would be citizens of the United States. • 70 would be unable to read. • 50 would suffer from malnutrition. • 80 would live in substandard housing. • Only 1 would have a college education.