Innovative Energy Efficiency Strategies: Harnessing Waste Energy for Sustainable Solutions
160 likes | 282 Views
This review explores two compelling energy efficiency cases. Case A emphasizes conventional systems focusing on high-quality heat utilization. It highlights stand-alone units' efficiency in applications like district heating and air conditioning. Case B presents innovative heat pumps, which capture waste energy to enhance overall system efficiency. By integrating waste heat recovery and utilizing it for cooling, heating, and drying, these systems convert waste into free energy, drastically reducing costs and promoting sustainability. This approach aligns with energy independence and environmental stewardship goals.

Innovative Energy Efficiency Strategies: Harnessing Waste Energy for Sustainable Solutions
E N D
Presentation Transcript
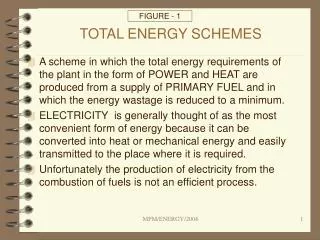
click ENERGY SCHEMES
click Energy-Efficiency Review of General Principles: Case A (Very Popular): Start with high quality heat & cascade its use until it cools Case B (Innovative): Collect waste energy and bring it back to DRIVE "heat pumps" to harvest energy from the environment for us to USE in cooling, airconditioning, drying, and heating
click Energy-Efficiency • Case A - Conventional systems -- medium to high efficiencies of “Stand-Alone” units • District Heating, Ovens, Vehicles, Power Plants, AirCons, Chillers, Freezers, Heaters • Case B - Heat Pumps -- extremely high “Overall System” efficiencies • "LiBr absorption heat pumps" -- use waste energy as input, therefore, FREE • Absorption heat pumps - collect waste, FREE • Mechanical heat pumps - collect waste, FREE
click Energy-Efficiency • Case A – Engineering culture calls for the design for efficient stand-alone systems • Case B – I have been successful in the emphasis of design for OVERALL SYSTEM EFFICIENCY, where we put together “stand-alone” systems to achieve envious results
click Typical Energy Split in Gasoline Internal Combustion Engines We USE only this much We WASTE the rest http://bioage.typepad.com/photos/uncategorized/energy_path_gasoline_ice.png
click "Heat Pumps" Harvest Energy from Environment E(o) Energy from System (use for heating/drying - FREE) Heat Pump E(i) Energy Input (recovered waste heat from engine – FREE!) E(c) Energy from Chiller - FREE (from environment - produce OR aircon) Coefficient of Performance (COP) = E(c) / E(i) COP (Electrical/Mechanical Compressors) = 2.5 to 6.43 COP (LiBr Absorption Systems) = 1.0 to 1.4 COP (NH3 Absorption Systems) = 0.5 to 0.7
click “Cogeneration Scheme" The next slide shows: • Burn clean fuel in an engine (100 energy units) • Generate electricity and drive a mechanical chiller (10 units), which is a “heat pump”, for freezing applications, giving 30 units of FREE energy for heating and/or drying • Energy from the exhaust of the engine (25+50=75 units of FREE energy) • Send these 75 units to drive a Lithium-Bromide Absorption Chiller, also a “heat pump,” and RECOVER 158 units of FREE energy at the exhaust of the heat pump • The resulting “Energy Balance” is shown in the box, below HEAT PUMPS HARVEST From Fuel = 10+10+50+25+5 = 100 Harvested = 20+83 = 103 Recovered = 30+158 = 188 Grand Total = 100+188 = 288
click Energy for Heating and/or drying E[o] = E[i] +E[c] 10 + 20 = 30 (FREE ENERGY) ENERGY ALLOCATION in Co-Generation Scheme ==> with "Heat Pumps" (click to continue) Harvested by Heat Pump from the Environment E[c]= E[i] * (COP:2) = 20 START with CLEAN FUEL = 100 input energy to initiate the process (run like base-loaded plants) Mechanical Chiller/Freezer = 10 (E[i]) Electricity Generated = 10 Exhaust= 50 Lithium-Bromide Absorption Chiller E[i] = 50 + 25 = 75 Jacket= 25 Waste = 5 Harvested by Heat Pump from the Environment E[c] = 75 * (COP:1.11) = 83 Energy for Heating and/or Drying E[o] = 75 + 83 = 158 (FREE ENERGY) HEAT PUMPS HARVEST From Fuel = 10+10+50+25+5 = 100 Harvested = 20+83 = 103 Recovered = 30+158 = 188 Grand Total = 100+188 = 288
click “Functional Integration” The next slide shows how the whole cogeneration system is integrated • Left Click on this slide • The next slide will automatically ANIMATE itself
Functional Integration CoGen, Drying/Chilling,RenewableEnergy, Potable Water click Process for Potable Water RE Electrical Source Batteries Electrical Load Vapor Condenser Boiler 75kwh LiBr Chiller 158kwh For Heating Water Evaporator 25kwh Jacket 50kwh Exhaust Meat, Fish Fruit, etc Drying Chamber Steam Heater 100kwh LPG/LNG 20kwh Engine 10kwh Generator Solar Collector Solar Heater 158kwh LiBr 5kwh Waste For Heating Fresh Air 10kwh Compressor 30kwh Freezer Freezer Cold Storage De- Humidifier 5kwh Waste 30kwh For Heating
click The Merchandise / Commodity • Services Provided • Profitability jumps sky-high, as the system generates electricity from the FUEL • Strategic Advantage • use FREE energy from the waste heat for Chilling & Air-conditioning, Heating, & Drying (fish/meat/veggies/fruit) • ALL energy used is from ONLY ONE, not many independent sources • Innovative Energy-Efficiency Scheme leads to the UTILIZATION of FREE ENERGY resulting in the radical reduction of energy cost • Systems may be transportable for easy replication to other sites • This is an EXPORTABLE Commodity Consistent with the Government’s Thrust for ENERGY-INDEPENDENCE, and is a good STEWARD of the Earth and of the Environment
click Income Statement – no IMPROVEMENTS yet • Total Revenues RRRRR • Total Expenses EEE EEE • NIBIT (Net Income Before Interest and Taxes) • Less: Interest Payments • Less: Taxes • NIAT (Net Income After Taxes) • Cash Flow Statement – no IMPROVEMENTS yet • Sources Revenues LESS Costs • Uses Taxes PLUS Interest PLUS Principal • NNCF (Equity & Project Streams) Sources LESS Uses • IRR (Equity & Project) Dependent upon Investment and NNCF
click TO REVENUE STREAM: EEE + Savings in Displaced Electricity, Heating & Chilling + Carbon Credits + Government Incentives + Responsible Human Beings Caring for Planet Income Statement – with IMPROVEMENTS • Total Revenues RRRRR • Total Expenses EEE EEE • NIBIT (Net Income Before Interest and Taxes) = RADICALLY HIGHER • Less: Interest Payments = slightly higher (influenced by decisions) • Less: Taxes = very slightly higher • NIAT (Net Income After Taxes) = RADICALLY HIGHER • Cash Flow Statement – with IMPROVEMENTS • Sources Revenues LESS Costs = HIGHER • Uses Taxes PLUS Interest PLUS Principal = (decisions) • NNCF (Eq & Proj Streams) Sources LESS Uses = HIGHER • IRR (Equity & Project) Higher Streams == HIGHER IRR
click This is the final configuration of the US$65million Project that I conceptualized, led, and tendered. International bidders participated.
click Tristan Calasanz – about me . . . • Vice President for Utility Operations – National Power Corporation of the Philippines • Assets: US$10 billion; Gross Revenues: US$1 billion (1983) • Energy-Efficiency Savings: US$15 million (1983) • Vice President for Project Development – First Private Power Corporation • Co-Generation Facility: Conceptualization, Feasibility Studies, Engineering, Bid Evaluation • Project Investment: US$65 million • Associate for Energy Management – SGV&CO/ArthurAndersen&CO
the END Thank You!Tristan H Calasanzhttp://www.thcal.comhttp://www.beyondcogeneration.blogspot.comhttp://www.youtube.com/thcalasanztristan.calasanz@gmail.comtcalasanz@ateneo.eduDecember 8, 2013