Download
1 / 18
180 likes | 329 Views
The Northeast Megaregion, home to 49 million residents, represents 17% of the U.S. population and contributes 20% of the U.S. GDP. By 2050, its population is projected to increase by 19 million. This report outlines the challenges and opportunities for urbanization and mobility, exploring sustainable economic growth through improved transportation infrastructure. The focus is on the integration of intercity rail, reduction of greenhouse gas emissions, and enhancing accessibility to job markets and affordable housing across key growth centers, addressing critical congestion in transportation hubs.

E N D
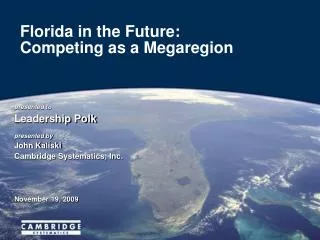
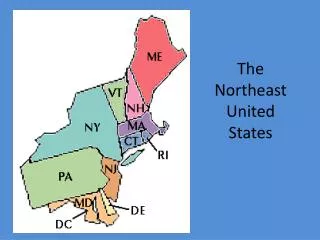
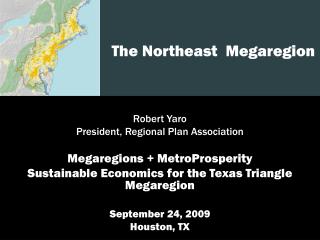
The Northeast Megaregion Robert Yaro President, Regional Plan Association Megaregions + MetroProsperity Sustainable Economics for the Texas Triangle Megaregion September 24, 2009 Houston, TX
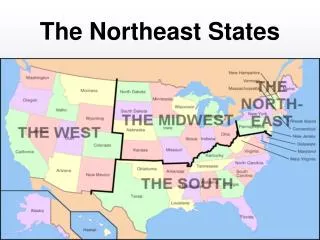
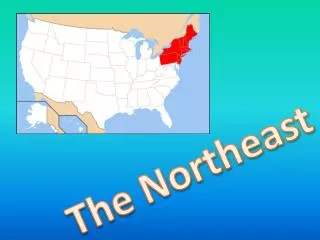
Boston New York Philadelphia Baltimore Washington The Northeast Megaregion • 49 million inhabitants • 17% of U.S. population on 2% of the land area • 20% of U.S. GDP • Will add 19 million additional people by 2050
Change in Urbanized Land 2000 - 2050 Year Acres % of Total 2000 14,657,028 9.7% 2025 25,487,087 16.4% 2050 39,128,555 25.2% Source: RPA GIS Model, Woods & Poole County Population projections Urbanized Areas 2000 - 2050
Change in Urbanized Land 2000 - 2050 Year Acres % of Total 2000 14,657,028 9.7% 2025 25,487,087 16.4% 2050 39,128,555 25.2% Source: RPA GIS Model, Woods & Poole County Population projections Urbanized Areas 2000 - 2050
Change in Urbanized Land 2000 - 2050 Year Acres % of Total 2000 14,657,028 9.7% 2025 25,487,087 16.4% 2050 39,128,555 25.2% Source: RPA GIS Model, Woods & Poole County Population projections Urbanized Areas 2000 - 2050
2000 - 2050 Exurban and Suburban land types Conversion of farmland and forests Fastest Projected Growing Areas
Large Landscapes and Estuaries At Stake… Source: RPA, adapted from the Appalachian Mountain Club
Congested Roads, Rails, and Sky Image: University of Pennsylvania
Airports are reaching Gridlock • 20 percent of flights in the NY Metro region are 350 miles or less • By 2010 airfields at Newark and JFK will approach capacity • Roundtrip Flights Daily • DC – NY: 86 • NY – Bos: 76 • Bos – DC: 42
Business Alliance for Northeast Mobility • Coalition of chambers of commerce, civic organizations • Focus on Amtrak authorization and appropriations • Advocacy for NE interests in surface transportation bill Reception in U.S. Capitol Apr 2008 Northeast Summit Mar 2007 Union Station Press Conference Oct 2008
Density Peaks: Hubs of Face-to-face Communication
Increase Capacity for Economic Growth • Provide alternatives and redundancy to congested air travel, roads • Increase frequency, speed, reliability, affordability of intercity rail • Increase capacity of regional rail services
Meet Targets for Greenhouse Gas Reductions • On a per passenger basis, Amtrak is: • 18% more energy efficient than airlines • 17% more efficient than autos (Source: Oak Ridge Nat’l Lab. Transportation Energy Data Book) • Air travel has greater GHG impact than ground emitters. • (CO2, H2O, NOx in stratosphere.)
Connect Hot and Cold Growth Centers • Expand rail service to underperforming cities • Expand job markets and access to lower-cost housing • Focus investments around station areas - TOD Future Moynihan Station West – Hub on the NEC “Hot and Cold” Index of the Northeast: U. Penn 2004