Download
1 / 59
620 likes | 825 Views
Modeling signal transduction. Phototransduction from frogs to flies. Eye as an evolutionary challenge.

E N D
Modeling signal transduction Phototransduction from frogs to flies
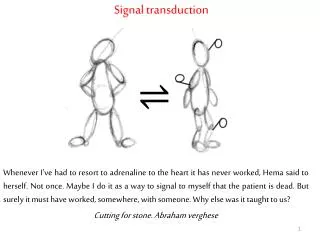
Eye as an evolutionary challenge “To suppose that the eye, with all its inimitable contrivances …, could have been formed by natural selection, seems, I freely confess, absurd in the highest possible degree. Yet reason tells me, … “ C. Darwin, The Origin of Species: Darwin goes on to describe how eye may have evolved through accumulation of gradual improvements A number of different designs exist: e.g. vertebrate, molluskan or jellyfish “camera” eyes or insect “compound eye” The eye may have evolved independently 20 times!! (read “Cells, Embryos and Evolution” by Gerhart&Kirschner)
Eyes are present in most metazoan phyla: how did they evolve? Copepod's 2 lens telescope Scallop Trilobite fossil 500 million years House Fly Black ant Octopus Cuttlefish See Gerhart and Kirschener, “Cells, Embryos and Evolution”
The grand challenge: To understand the evolutionary processes that underlie the appearance of a complex organ (an eye). To what extent is the similarity between different eyes (e.g. vertebrate and mollusk) is due to common ancestry or is the result of evolutionary convergence due to physical constraints? What can we learn from the similarities and differences in the architecture/anatomy, development and molecular machinery of eyes (or light sensitive cells) in different species? BUT before we can address the question of evolution we need first to learn how it works…
More broadly: Molecular pathway(s) of phototransduction are similar to many other signaling pathways: olfaction, taste, etc “Comparative Systems Biology”
Modeling molecular mechanisms of photo-transduction Case studies: 1) vertebrate and 2) insect Phototransduction as a model signaling system
100mm Vertebrate photoreceptor cell Rod Outer Segment (2000 Discs) hv Rhodopsin Na+ Na+, Ca2+ Discs Light reduces the “dark current” into the cell
Turtle Rod: a flash response family shown on different time scales Turtle Cone Intracellular Voltage in Rods and Cones
Electrophysiology of Rods In the dark a standing current circulates through the rod. Light shuts off the influx of current into the outer segment, while K continues to exit the inner segment causing the cell to hyperpolarize. Na, Ca cGMP Na, Ca cGMP Ca,K Ca,K Na Na Na Na K K K K K K K K K ATP driven Na/K pump Na,Ca channels of outer segment need cGMP to stay open
Light detector protein: Rhodopsin Rhodopsin undergoes light-induced conformational change chromophore, 11-cis retinal + opsin, a membrane protein with 7 transmembrane segments
Light-induced conformational transition cytoplasmic side
Seven-Helix G-protein- Coupled Receptors form a large class (5% C. elegans Genome !) b2 adrenergic receptor Rhodopsin cytoplasmic end
Rhodopsin is a G-Protein coupled receptor photoactivated rhodopsin (Rh*) forms in about 1 ms and serially activates 100 to 1000 Transducin molecules per second Transducin is a heterotrimeric G protein specific to vision light Rhodopsin about109 rhodopsin molecules and about 108 G-protein molecules per rod outer segment (ROS) Rh* Tabg Ta* + Tbg GDP GTP
G- proteins a b a subunit: 35-45 kD g bsubunit: 35-40 kD g subunit: 6-12 kD guanine nucleotide binding site on a subunit At least 15 different genes for a subunit and several different genes for b and g subunits
Steps in activation extracellular cell membrane Resting state: (G protein off) a g b GDP G protein coupled receptor (GPCR) b 1. receptor activated by action of external signal Binding of activated receptor to G protein opens guanine nucleotide binding pocket on a subunit a g GDP
2. GDP -- GTP exchange at nucleotide binding site activates the G protein a* a a* g g g GTP GDP b b b GTP The a and bg subunits dissociate from activated GPCR 3. Activated a subunit stimulates effector proteins: enzymes or ion channels GTP
“Effector” light Rhodopsin Rh* Tabg-GDP Ta*-GTP + Tbg PDE PDE* cGMP GMP CNG Channels: OPEN CLOSED
Where did cGMP come from? Guanylate Cyclase GTP cGMP + PPi GMP Phosphodiesterase
G Protein Effectors Include hydrolyzes cyclic nucleotide; e.g. cGMP GMP Phosphodiesterase (PDE) Adenylyl cyclase Phospholipase C synthesizes cAMP from ATP Enzymes: hydrolyzes PIP2 to produce IP3 and diacylglycerol (DAG) Ion channels: e.g. K, Ca and Na channels
Shut-off light Rhodopsin Rh* Tabg-GDP Ta*-GTP + Tbg PDE PDE* cGMP GMP CNG Channels: OPEN CLOSED Next question: How are the activated intermediates shut off?
Transducin is inactivated by the a intrinsic GTPase activity which hydrolyzes GTP to GDP a* g g g In Time b b b a GTP GDP a GDP + Pi Taandbg re-associate Accelerated byPDE* Ta-GDP dissociates from PDE* which re-inhibits PDE*
The intrinsic GTPase activity of the a subunit is regulated by a GAP (GTPase accelerating protein) RGS-9 a* g g b b a GDP + Pi GTP Ta*shut off is accelerated by action of RGS-9 Regulator of G-protein signaling
Recovery to the resting state requires resynthesis of the cGMP that had been lost to hydrolysis. This is accelerated by low Ca (feedback signal!) that stimulates Guanylate Cyclase GTP cGMP + PPi
Ca- the second “2nd messenger” Na, Ca cGMP Na, Ca cGMP Ca,K Ca,K Na Na Na Na K K K K K K K K K channel closure shuts off Ca influx, while efflux by Na:Ca,K exchange continues and internal Ca declines. The fall in [Ca] is the [Ca] feedback signal.
Negative feedback Ca2+ Regulation of Guanylate Cyclase
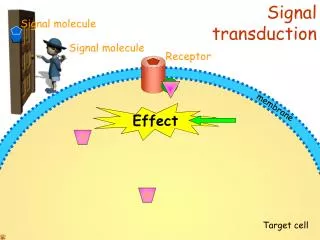
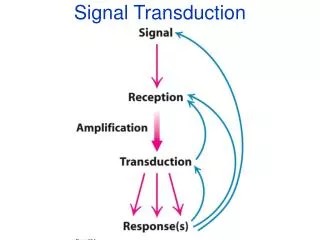
Signaling cascade • Converts a microscopic stimulus • activation of a single molecule – • into a macroscopic response Alberts et al, “Mol Bio of the Cell”
Phototransduction Cascadeas an enzymatic amplifier Total gain: 2 x 10⁵– 106 cGMP / Rh* light Rhodopsin Rh* 1st Stage of amplification: 200 - 1000 G* per Rh* Gabg- GDP G*a- GTP + Gbg 2nd Stage amplification: each PDE* hydrolyzes ~ 100 cGMP molecules. Phosphodiesterase (PDE) PDE* GC* GTP cGMP GMP channel closure generates electrical signal CNG Channels: OPEN CLOSED
Olfaction: olfactory cilium mucus film tight junction olfactory knob supporting cell receptor dendrite cell body basement membrane axon
Olfactory receptorcascade Odor ligand Olfactory receptor R R* Gabg- GDP G*a- GTP + Gbg AC Adenylate cyclase AC* ATP cAMP AMP PDE* DEPOLARIZATION OF THE CELL CNG Channels: OPEN
Rhodopsin light Invertebrate Phototransduction Cascade Rh* Gqa*- GTP + Gqbg Gq- GDP Phospholipase C PLC* PIP2 IP3 & DAG ( phosphoinositol 3,4 bisphosphate ) ? Trp Channels: CLOSED OPEN
cGMP GMP GTP GC PDE* Enzymatic amplifier modules GDP G* GTP 1st stage: G-protein (Transducin) activation and deactivation PDE* Rh* G Pi GDP GTP 2nd stage: cGMP hydrolysis and synthesis Note: [GTP] / [GDP] & [GMP] acts a metabolic “power supply”
cGMP GMP GTP More examples of amp modules GDP ADP G* SP GTP GAP GEF Phosphotase Kinase G S Pi Pi GDP GTP ATP Small GTPases: Ras, Rho, Rab, Rap, Reb,… Vasodilation Receptor Guanylate Cyclase Nitric Oxide PDE5 Viagra
General “push-pull” amplifier circuit Xc* a “Power supply”: Eact Ede-act a+b c maintains high [c]/[a] Xa c b Steady state: Note: [X*]/[X] = e-bDEbecause the system is held out of equilibrium by fixed [c]/[a] maintained by metabolism
Amplifier gain and time constant Small change in [X*] induced by a small change in [Eact]: Linear response (in the Fourier domain): Static gain Time constant Note: g ~ t the gain-bandwidth “theorem” !!
Linear analysis of vertebrate phototransduction Rh* deactivation + 2 amplifier “modules” with negative feedback via [Ca++] Good approximation to weak flash (single photon) response
Linear analysis of the cascade Assuming stoichiometric processes of PDE* and Ch* activation are “fast” : d PDE* ~ d G* d Ch* ~ d cGMP*
“Hard” and “Soft” parameters Kinetic constants/affinities -- “hard” parameters change on evolutionary time scale Enzyme concentrations -- “soft” parameters that can be regulated by the cell. e.g. Golden rule of biological networks: “anything worth regulating is regulated”
General behavior { at short times at times times For: With n=3 - good fit to single-photon response
Case of feedback + gFd[Ca] feedback via dCh*
Consequences of negative feedback Reduction of static gain: Accelerated recovery: “Ringing”:
Signal and Noise: How much gain is enough? Single photon “signal”: } dI ~ 2 pA dI /I Dark ~ 3% I Dark ~ 60 pA What’s the dominant source of background noise? Thermal fluctuations? ROS capacitance C ~ 20pF Negligible !
Reaction shot noise Langevin noise (i.e. Gaussian, White) # of molecules E.g. ifG- = 0 consider DX* produced over time Dt Poisson process