Download
1 / 26
260 likes | 393 Views
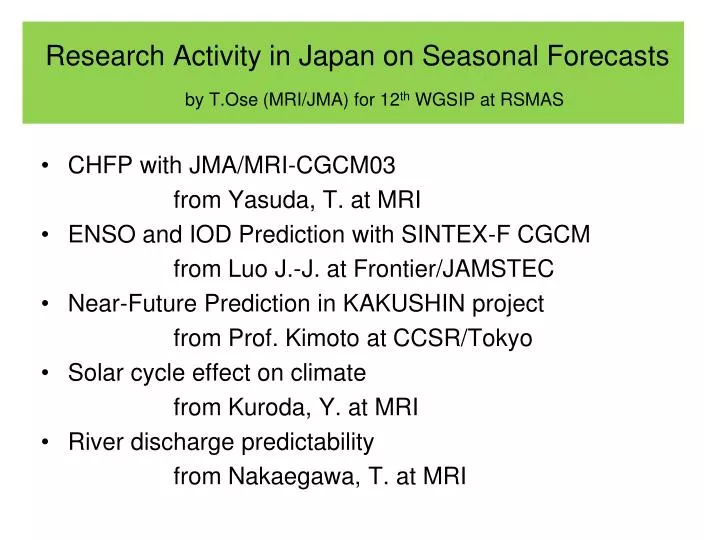
Research Activity in Japan on Seasonal Forecasts by T.Ose (MRI/JMA) for 12 th WGSIP at RSMAS. CHFP with JMA/MRI-CGCM03 from Yasuda, T. at MRI ENSO and IOD Prediction with SINTEX-F CGCM from Luo J.-J. at Frontier/JAMSTEC

E N D
Research Activity in Japan on Seasonal Forecastsby T.Ose (MRI/JMA) for 12th WGSIP at RSMAS • CHFP with JMA/MRI-CGCM03 from Yasuda, T. at MRI • ENSO and IOD Prediction with SINTEX-F CGCM from Luo J.-J. at Frontier/JAMSTEC • Near-Future Prediction in KAKUSHIN project from Prof. Kimoto at CCSR/Tokyo • Solar cycle effect on climate from Kuroda, Y. at MRI • River discharge predictability from Nakaegawa, T. at MRI
Seasonal Prediction Experiment in the new JMA/MRI Coupled Model Yasuda, T. (MRI), Y. Takaya (JMA), Y. Naruse (JMA) and T.Ose (MRI) The new system for forecasting SST in the equatorial Pacific using a coupled atmosphere-ocean model has been developed at JMA/MRI. This system is being used for the new JMA operational system for ENSO forecast since spring 2008. We have conducted the retrospective seasonal prediction experiments using this system based on the CHSP strategy.
Seasonal Forecast System and Experiments CGCM (JMA/MRI-CGCM03) System Components AGCM: JMA atmospheric model TL95L40 OGCM: MRI Community Ocean Model (MRI.COM) 1.0x(0.3-1.0)L50 Coupling time: 1 hour Flux adjustment: Momentum and heat fluxes adjustment Experiments 7-month 10-member ensemble prediction initiated at the end of January, April, July and October from 1979 to 2006. Initial Conditions Atmosphere: JRA-25 reanalysis Ocean: Ocean Data Assimilation System “Multivariate Ocean Variational Estimation System (MOVE-G/MRI.COM)”
Asian Monsoon Precipitation is much improved by CGCM. AGCM MSSS CGCM MSSS CGCM COR AGCM COR
Asian Summer Monsoon Index (WYI)(4-month lead: JJA from JAN) CGCM AGCM Blue: Forecast Red: Analysis ACC: 0.35 Blue: Forecast Red: Analysis ACC: 0.59 WYI Definition:(0-20N,40-110E) Mean of U850–U200
Seasonal-to-interannual climate prediction using SINTEX-F CGCM – ENSO and IOD prediction– Jing-Jia Luo (羅京佳,luo@jamstec.go.jp) Climate Variations Research Program Frontier Research Center for Global Change JAMSTEC, Japan Collaborators: Sebastien Masson, Swadhin Behera, Yukio Masumoto, Hirofumi Sakuma, and Toshio Yamagata
The SINTEX-F Coupled GCM (Luo et al. GRL 2003, J. Clim. 2005a; Masson et al. GRL 2005) 1. Model components: AGCM(MPI, Germany): ECHAM4 (T106L19) OGCM(LODYC, France): OPA8 (2 x 0.52, L31) Coupler(CERFACS, France): OASIS2 * No flux correction, no sea ice model 2. International collaborators: LODYC: OPA model group INGV (Italy): Antonio Navarra’s group MPI-Met: ECHAM model group CERFACE: OASIS coupler group PRISM project group Running on the Earth Simulator
ENSO prediction skill of 10 coupled GCMs Nino3.4 index (1982-2001) Adapted from Jin et al. 2008, APCC CliPAS
Extended ENSO prediction: 0.5 ACC Ensemble mean ACC Each member Persistence RMSE (120º-170ºW, 5ºS-5ºN) Nino3.4 SSTA prediction Luo et al., J. Climate, 2008, 84-93.
IOD Impacts in 2006 boreal fall Rainfall Anomalies Sep-Nov 2006 Corresponding SST Anomalies fires in Borneo and Sumatra Severe drought devastated farmers in eastern Australia, estimated loss of 8 billion AUD. More than 1 million people in Kenya, Somalia and neighboring countries were affected by the flooding.
Both winter and spring barrier exist (90º-110ºE, 10ºS-0º) Indian Ocean Dipole 9-member ensemble hindcasts (1982-2004) 0.5 Predictable up to ~2 seasons ahead. Luo et al., J. Climate, 2007, 2178-2190.
Summary: • ENSOcan be predicted out to 1-year lead and even up to 2-years ahead in some cases. • ISOs may limit ENSO predictability in certain cases. • The results suggest a potential predictability for decadal ENSO-like process. • IOD can be basically predicted up to ~2 seasons ahead. • Extreme IOD events (and their climate impacts) can be • predicted up to 1-year lead. Real time forecasts at one month intervals: http://www.jamstec.go.jp/frcgc/research/d1/iod/index.html
From Prof.Kimoto (CCSR) Ensemble hindcast/forecast Assimilation/Initialization Japanese CLIMATE 2030 Project 110km mesh model • A near-term prediction up to 2030 with a high-resolution coupled AOGCM • 60km Atmos + 20x30km Ocean • w/ updated cloud PDF scheme, PBL, etc • advanced aerosol/chemistry • Estimate of uncertainty due to initial conditions • 10(?)-member ensemble • For impact applications • water risk assessment system • impacts on marine ecosystems • etc. • Test run w/ 20km AOGCM (in 2011) 60km mesh model 5-min topography
Decadal Predictability?Assimilation vs. Hindcasts w/ &w/oinitialization Global SAT PDO SPAM: System for Prediction and Assimilation by MIROC Motizuki et al. (2009)
Solar cycle effect on climate -Review and recent works related on the modulation of the Annular Mode- Yuhji Kuroda (Meteorological Research Institute, JAPAN)
~0.1% variation of solar irradiance is observed for the 11-year Solar Cycle (SC)
Observation (ERA40) Correlation with S-SAM (Nov) Contour greater than 0.5 Shading greater than 0.4 Zonal wind S-SAM Correlation with surface 0.6 0.4 larger
Experiment with varying UV Ultra Solar (US) High Solar (HS) Low Solar (LS) UV:strong UV:weak Stratospheric SAM (S-SAM): EOF1-Z30 in late winter (Dec) Compares correlation with S-SAM
Chemistry-Climate Model Correlation with S-SAM (Dec) Contour greater than 0.5 Shading greater than 0.44 (95%) Zonal wind Correlation with surface 0.8 0.6 0.3 larger Stratosphere-troposphere coupling tends to be stronger with increasing UV!!
Possible Physical mechanism of the solar-cycle modulation of the SAM • Solar irradiance change is too small to change climate energetically. • UV change is one promising process. • Ozone anomaly changes temperature in the lower stratosphere to upper troposphere in summer. • Such temperature anomaly creates anomalous zonal wind. • Anomalous zonal wind modifies wave propagation.
Bibliography 1, Solar-cycle modulation of winter-NAO Kodera, K., GRL 2002, doi:10.1029/2001GL014557 Ogi et al., GRL 2003, doi:10.1029/2003GL018545 Kuroda et al., JGR 2008, doi:10.1029/2007jd009336 in press Kuroda, Y., J. Meteorol. Soc. Japan 2007,Vol 85, 889-898 2, Solar-cycle modulation of late-winter/spring SAM Kuroda and Kodera, GRL 2005, doi:10.1029/2005GL022516 Kuroda et al., GRL 2007, doi:10.1029/2007GL030983 3, Simulation of solar-cycle modulation of AO or SAM by CCM Tourpali et al., GRL 2005, doi:10.1029/2005GL023509 Kuroda and Shibata, GRL 2006, doi:10.1029/2005GL025095
Potential predictability of seasonal mean river discharge in dynamical ensemble prediction using MRI/JMA GCM Tosiyuki Nakaegawa MRI, Japan
River discharge: accumulation P-E: each grid Physical characteristics of river discharge • River discharge is a collection of total runoffs in an upper river basin, which is similar to the area average process. The collection is likely to reduce the unpredictable variability and, as a result, to enhance the predictability.
C20C Experiment setup • AGCM: MJ98,T42 with 30 vertical layers • River Routing Model: GRiveT, 0.5o river channel network of TRIP, velocity: 0.4m/s • Member: 6 • SST & Sea Ice : HadISST (Rayner et al. 2003) • CO2 : annualy varying • Integration period: 1872-2005 • Analysis period:1951-2000
Potential Predictability • Definition: The maximum value that an ensemble approach can reach, assuming that perfectly predicted SSTs are available and that the model perfectly reproduces atmospheric and hydrological processes. • Variance ratio: measure of • PP based on the ANOVA • (Rowell 1998).
Collection Effect • How much influence does the collection effect over a river basin have on the potential predictability of river discharge? Variance Ratio: (Discharge)-(P-E) Improvement Basin areas >106km2 Does not work effectively Cause deterioration