Download
1 / 28
280 likes | 407 Views
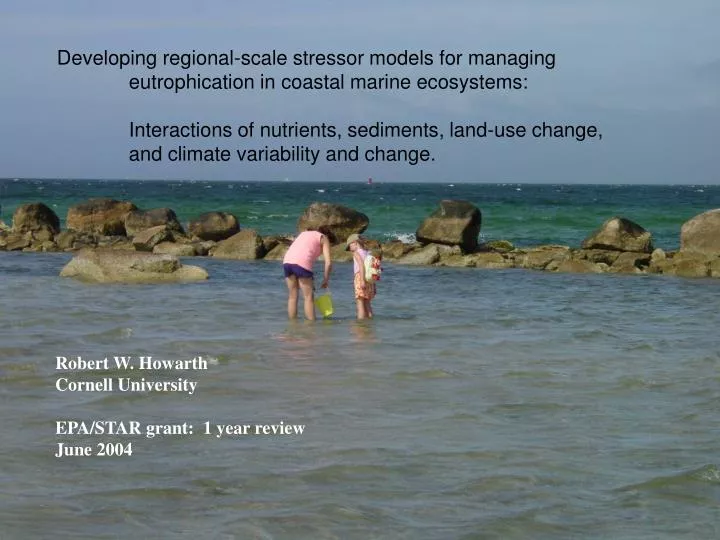
Developing regional-scale stressor models for managing eutrophication in coastal marine ecosystems: Interactions of nutrients, sediments, land-use change, and climate variability and change. Robert W. Howarth Cornell University EPA/STAR grant: 1 year review June 2004. NRC 2000:

E N D
Developing regional-scale stressor models for managing eutrophication in coastal marine ecosystems: Interactions of nutrients, sediments, land-use change, and climate variability and change. Robert W. Howarth Cornell University EPA/STAR grant: 1 year review June 2004
NRC 2000: Nitrogen is now the largest pollution problem in the coastal waters of the United States. Two thirds of coastal rivers and bays are moderately to severely degraded from nitrogen pollution.
NRC 2000: • Priority recommendations: • Improve models for determining how management actions may affect nitrogen fluxes from watersheds, and how these may be affected by climate variability and change • Develop a classification scheme for the sensitivity of estuaries to nitrogen inputs, as an aid for management decisions
Principal Investigator: Robert Howarth, Cornell (biogeochemistry, ecosystem science) Key Personnel and consultants: Roxanne Marino, Cornell (coastal marine biogeochemistry, ecosystem science) Dennis Swaney, Cornell (watershed modeling) Elizabeth Boyer, SUNY/Syracuse ( watershed hydrology) Merryl Alber, Univ. of Georgia (ecology of southeastern rivers and estuaries) Don Scavia, Univ. of Michigan (water quality modeling) David Jay, Oregon State (physical oceanography)
Estuaries vary in sensitivity to nitrogen inputs. Examples: Chesapeake vs. Delaware & San Francisco Bays, Hudson River estuary. For management, target nitrogen reductions for ecosystems that are most sensitive. Will climate change increase or decrease sensitivity?
A. B. 20 5 4 15 GPP (g C m-2 d-1) Water Residence Time (d) 3 10 2 5 1 0 0 200 400 600 800 1000 0 0 200 400 600 800 1000 C. 7 6 5 Depth at 1% light (m) 4 3 2 1 0 0 200 400 600 800 1000 Discharge (m3 sec-1) Residence time has other Influences on Sensitivity to eutrophication Mesohaline Hudson River Estuary (Howarth et al. 2000)
Water residence time as master variable controlling sensitivity? • If so, highly responsive to climate variability and change, • through change in freshwater runoff.
Water residence time as master variable controlling sensitivity? • Residence time has numerous influences on sensitivity, • mediated through: • -- flushing of phytoplankton relative to growth • -- flushing and dilution of nutrients • -- influence on denitrification • -- flushing of zooplankton populations relative to growth
Nutrient dilution effect Chl/N load Residence time
Nutrient dilution effect Chl/N load Phytoplankton flushing Chl/N load Residence time
Nutrient dilution effect Chl/N load Phytoplankton flushing Chl/N load Denitrification Chl/N load Residence time
Nutrient dilution effect Chl/N load Phytoplankton flushing Chl/N load Denitrification Chl/N load Top-down Control by zooplankton Chl/N load Residence time
Nutrient dilution effect Chl/N load Phytoplankton flushing Chl/N load Denitrification Chl/N load Top-down control by zooplankton Chl/N load Combined influences Chl/N load Residence time
Potential classes of sensitivity to nitrogen pollution Chl/N load Residence time
What next?Use a simple simulation model of phytoplankton growth at different N loadings to evaluate potential interacting effects of residence time on sensitivity to eutrophication. Develop data set on chlorophyll, N loading, and water residence times in estuaries, using consistent approaches. Use this data set for statistical analysis of response pattern. Eventually, begin to consider factors other than water residence time (turbidity, stratification and depth of mixing, benthic grazing).
DIN,DIP, etc concentration Nutrient Export DIN,DIP, etc concentration Nutrient Export Flowchart of ReNuMa hydrology and dissolved nutrient transport ReNuMa: Regional Nutrient Management model
Flowchart of ReNuMa erosion, sediment, and adsorbed nutrient transport
Swaney et al., 1996) The parent model (GWLF) does well with hydrology… It also predicts erosion well, and so does well with phosphorus fluxes. GWLF lacks some essential processes for nitrogen, particularly atmospheric deposition and denitrification. We are adding these, plus more on agricultural management options, for ReNuMa.
Preliminary model runs to evaluate the response of a watershed to hypothetical scenarios of landuse or climate change… In this case, climate changes (an increase of 2 degrees C and 20% increase in precipitation over 10 years) are considered, together with a doubling of area of urban and agricultural landuses…
Anthropogenic nitrogen sources and relationships to riverine nitrogen export in the northeastern USA Boyer et al. 2002
NE region: watershed nitrogen inputs Boyer et al. 2002
Moderate-sized Watersheds, Northeastern US (Boyer et al) Note slope = 0.26 and intercept = 107 kg km-2 yr-1
2000 y = 0.26x + 106.7 R2=0.62 1600 1200 Riverine N flux (kg N km-2 yr-1) 800 400 0 1000 2000 3000 4000 5000 NANI (kg N km-2 yr-1) 800 600 y = 1.75x - 947.7 R2 = 0.40 400 200 0 100 200 300 400 700 -200 -400 -600 -800 Residual (kg N m-2 yr-1) Discharge (mm yr-1)
2000 1800 1600 1400 2 R = 0.8164 1200 1000 800 600 400 200 0 0 200 400 600 800 1000 1200 1400 1600 Riverine N fluxes very well predicted from net anthropogenic N inputs, attenuated by discharge-predicted fractional delivery. Riverine N flux (kg N km-2 yr-1) (5 x 10⁻⁴ * Discharge) * (NANI) + 115 kg N km-2 yr-1
Next steps with ReNuMa watershed model: • add a module for atmospheric deposition of nitrogen onto the landscape • add denitrification sink terms, as a function of climate • improve modules for agricultural management options, with emphasis on nitrogen exports • work with stakeholders in Susquehanna drainage basin within New York State to make model more useful for decision makers