Download
1 / 14
720 likes | 2.91k Views
3-3 Measures of Position. z -score Percentile Quartile Outlier. Measures of Position: z -score. A z -score or standard score for a value is obtained by subtracting the mean from the value and dividing the result by the standard deviation.

E N D
3-3 Measures of Position • z-score • Percentile • Quartile • Outlier Bluman Chapter 3
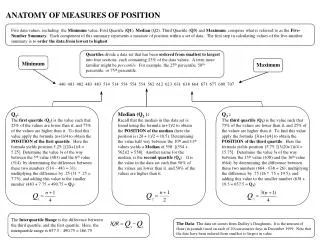
Measures of Position: z-score • A z-score or standard score for a value is obtained by subtracting the mean from the value and dividing the result by the standard deviation. • A z-score represents the number of standard deviations a value is above or below the mean. Bluman Chapter 3
Example 3-29: Test Scores A student scored 65 on a calculus test that had a mean of 50 and a standard deviation of 10; she scored 30 on a history test with a mean of 25 and a standard deviation of 5. Compare her relative positions on the two tests. She has a higher relative position in the Calculus class. Bluman Chapter 3
Measures of Position: Percentiles • Percentiles separate the data set into 100 equal groups. • A percentile rank for a datum represents the percentage of data values below the datum. Bluman Chapter 3
Measures of Position: Example of a Percentile Graph Bluman Chapter 3
Example 3-32: Test Scores A teacher gives a 20-point test to 10 students. Find the percentile rank of a score of 12. 18, 15, 12, 6, 8, 2, 3, 5, 20, 10 Sort in ascending order. 2, 3, 5, 6, 8, 10, 12, 15, 18, 20 6 values A student whose score was 12 did better than 65% of the class. Bluman Chapter 3
Example 3-34: Test Scores A teacher gives a 20-point test to 10 students. Find the value corresponding to the 25th percentile. 18, 15, 12, 6, 8, 2, 3, 5, 20, 10 Sort in ascending order. 2, 3, 5, 6, 8, 10, 12, 15, 18, 20 The value 5 corresponds to the 25th percentile. Bluman Chapter 3
Measures of Position: Quartiles and Deciles • Deciles separate the data set into 10 equal groups. D1=P10, D4=P40 • Quartiles separate the data set into 4 equal groups. Q1=P25, Q2=MD, Q3=P75 • The Interquartile Range, IQR = Q3 – Q1. Bluman Chapter 3
Step 1 Arrange the data in order from lowest to highest. Step 2 Find the median of the data values. This is the value for Q2. Step 3 Find the median of the data values that fall below Q2. This is the value for Q1. Step 4 Find the median of the data values that fall above Q2. This is the value for Q3. 3.3 Measures of Position Finding Data Values Corresponding to Q1, Q2, and Q3
Example 3-36: Quartiles Find Q1, Q2, and Q3 for the data set. 15, 13, 6, 5, 12, 50, 22, 18 Sort in ascending order. 5, 6, 12, 13, 15, 18, 22, 50 Bluman Chapter 3
Measures of Position: Outliers • An outlier is an extremely high or low data value when compared with the rest of the data values. • A data value less than Q1 – 1.5(IQR) or greater than Q3 + 1.5(IQR) can be considered an outlier. Bluman Chapter 3
3.4 Exploratory Data Analysis • The Five-Number Summary is composed of the following numbers: Low, Q1, MD, Q3, High • The Five-Number Summary can be graphically represented using a Boxplot. Bluman Chapter 3
Constructing Boxplots • Find the five-number summary. • Draw a horizontal axis with a scale that includes the maximum and minimum data values. • Draw a box with vertical sides through Q1 and Q3, and draw a vertical line though the median. • Draw a line from the minimum data value to the left side of the box and a line from the maximum data value to the right side of the box. Bluman Chapter 3
Example 3-38: Meteorites The number of meteorites found in 10 U.S. states is shown. Construct a boxplot for the data. 89, 47, 164, 296, 30, 215, 138, 78, 48, 39 30, 39, 47, 48, 78, 89, 138, 164, 215, 296 Five-Number Summary: 30-47-83.5-164-296 Q1 Low MD Q3 High 47 83.5 164 296 30 Bluman Chapter 3