Download

1 / 15
150 likes | 245 Views
FY 2013 U.S. Agricultural Trade Forecasts. Changes to FY 2013 Forecasts Exports $1.5 billion to $145 billion Imports $2.0 billion to $115 billion Surplus $3.5 billion to $30 billion.

E N D
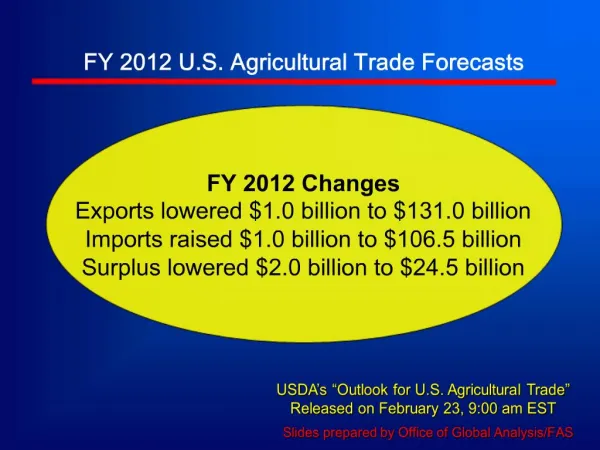
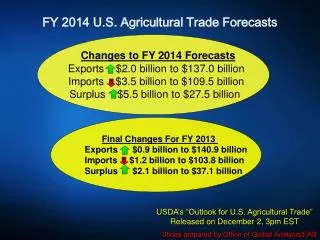
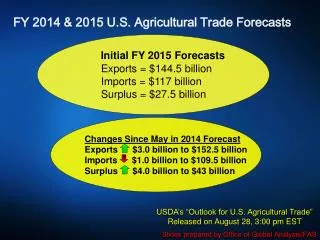
FY 2013 U.S. Agricultural Trade Forecasts Changes to FY 2013 Forecasts Exports $1.5 billion to $145 billion Imports $2.0 billion to $115 billion Surplus $3.5 billion to $30 billion Final Changes For 2012 Exports $0.7 billion to $135.8 billionImports $3.1 billion to $103.4 billionSurplus $2.4 billion to $32.4billion • USDA’s “Outlook for U.S. Agricultural Trade” • Released on November 29, 4:00 pm EST • Slides prepared by Office of Global Analysis/FAS
U.S. Agricultural Trade • Soybean exports surge on higher volumes and prices while corn exports fall 145 137.4 135.8 • Records 115 103.4 Exports 42.5 • Imports 32.4 • Trade Surplus
Higher soybeans exports outweigh lower grain and cotton • November vs. August Commodity Forecasts -$1.9 Billion • No Change +$3.3 Billion • -$0.1 Billion • November • August • -$0.2 Billion
Higher Grains, Oilseeds, and Hort. Products Lead to Record Forecast • November FY 2013 Forecast vs. FY 2012 Exports +$3.7 Billion • +$3.4 billion +$2.8 Billion • No Change • FY 2013 • FY 2012 • -$2.0 Billion
Bulk Exports Rebound While High Value Products Continue to Climb $ 50 Billion $ 86 Billion $ 91 Billion $ 54 Billion
Export Volume Continues to Fall 166 mmt 146 mmt 140 mmt *Includes cotton, rice, soybean meal, soybean oil, beef & veal, pork, beef and pork variety meats, broiler meat, and tobacco
China Remains Top Market Canada Mexico China
Exports Up to China and S.E. Asia Change in FY 2013 Exports from August Forecast +$200 mil +$200 mil $700 mil -$200 mil +$200 mil +$500 mil
Export Outlook for Grain & Feed Products Revised FY 2013 Forecast: $37.1 billion $1.9 billion 2013 Key Developments • Wheat volume down slightly–competition from India, Russia, and Ukraine. • Wheat value down on lower prices but still high historically. • Corn volume and value down on strong competition from Brazil, Argentina, and Ukraine Wild Cards • South American crop • Southern Hemisphere winter wheat crops
Export Outlook for Oilseeds & Products Revised FY 2013 Forecast: $31.4 Billion $3.3 Billion 2013 Key Developments • Soybean production exceeds earlier expectations • Strong China soybean demand to continue • Less competition from South America • Record soybean and soybean meal prices Wild Cards • China’s soybean import demand • Prospects and timing of South American harvest
Export Outlook for Cotton • Revised FY 2013 Forecast: $4.6 Billion, $200 million 2013 Key Developments • Lower volume expected, primarily due to reduced import demand in China Wild Cards • China reserve policy • India export policy
Export Outlook for Dairy, Livestock, and Poultry Revised FY 2013Forecast: $29.8 Billion $100 Million 2013 Key Developments • Beef down slightly as lower volumes offset marginally higher prices. • Poultry down due to lower unit values and volumes for turkey meat and offals. • Dairy up as higher global prices offset lower volumes. • Pork is raised slightly on higher unit values. Wild Cards • Changes in BSE protocols • Ongoing SPS trade issues • Chinese demand for diary and pork
Export Outlook for Horticulture Products Revised FY 2013 Forecast: $32.0 Billion Unchanged 2013 Key Developments • Long-term growth trend continues • Strong exports to Canada, EU, and Japan • Tree nut exports higher due primarily to China’s demand for almonds, pistachios and walnuts 2012 Key Developments • Continued Chinese demand for tree nuts • Record
FY 2013 Imports • Imports are forecast at a record $115 billion – down $2 billion from the Nov. forecast Imports $2 billion but remain at a record of 115 billion Tropical Products$1.7 billion– lower prices for sugar, coffee beans, and natural rubber resulting from the economic downturn in the EU and China. Horticultural Products$900 million–slow pace of processed fruit and vegetable imports in recent months expected to continue Grain and Oilseeds $1.0 billion –strong U.S. demand for imported corn Livestock & Dairy $100 million–lower beef and pork imports expected.