Download
1 / 14
140 likes | 231 Views
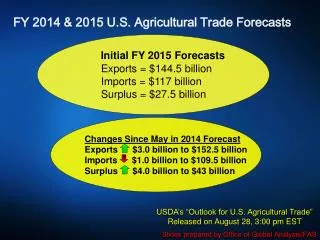
FY 2014 & 2015 U.S. Agricultural Trade Forecasts. Initial FY 2015 Forecasts Exports = $ 144.5 billion Imports = $117 billion Surplus = $27.5 billion.

E N D
FY 2014 & 2015 U.S. Agricultural Trade Forecasts Initial FY 2015 Forecasts Exports = $144.5 billion Imports = $117 billion Surplus = $27.5 billion Changes Since May in 2014 ForecastExports $3.0 billion to $152.5 billionImports $1.0 billion to $109.5 billionSurplus $4.0 billion to $43billion • USDA’s “Outlook for U.S. Agricultural Trade” • Released on August 28, 3:00 pm EST • Slides prepared by Office of Global Analysis/FAS
U.S. Agricultural Trade • Lower Bulk Export Prices and Greater Export Competition 152.5 141 144.5 • Records 117 109.5 103.8 Exports 43 37.1 • Imports • Trade Surplus
Exports forecast up $3 billion to a record $152.5 billion FY 2014 Exports Revisions (Aug. vs. May) • Grains, Oilseeds & Cotton • Grain and Feed $200 million - higher coarse grain exports more than • offset lower wheat exports • Oilseeds$1.0 billion - strong exports of both soybeans and meal • Cotton$300 million - strong unit values • Livestock & Horticultural Products • Livestock & Products$1.2 billion – most categories up, especially dairy • Horticultural ProductsNo Change
FY 2015 Forecasts • +$2.7 Billion • + $200 Million -$600 Million • - $500 Million -$4.9 Billion -$5.1 Billion
Most of Decline in Value of Bulk Exports Due to Lower Prices
Horticulture Expected to Be Largest Export Group for First Time Horticultural Products Grain & Feed and Products Oilseeds and Products
FY 2015 Export Changes by Market -$800 mil +$100 mil No Change -$400 mil -$3.0 bil -$200 mil -$500 mil -$800 mil -$400 mil -$1.4 bil
Despite Fall, China Remains Largest Market China Canada Mexico
Imports Forecast at a Record $117 Billion 26.2 23.3 51.4 47.4 20.8 20.8 15.6 15.9 *Includes Wheat, Corn, Sorghum, & Barley
Export Outlook for Grain & Feed Products Revised FY 2014 Forecast: $36.0 Billion $200 Million • Initial FY 2015 Projection: $31.1 Billion 2015 Key Developments • Corn volumes, values down on higher competition and weak prices • Wheat prices down with abundant global supplies. Wild Cards • New-crop South American corn plantings • Wheat production in Southern Hemisphere • 2015/16 Northern Hemisphere winter wheat planting • 2014 • Key Developments • Corn, sorghum boosted on strong demand
Export Outlook for Oilseeds & Products • Initial FY 2015 Projection: $29.7 Billion • Revised FY 2014 Forecast: $34.8 Billion $1.0 Billion 2015 Key Developments • Export value down on lower unit prices • Soybean complex volumes rise on strong demand, lower prices • Soybean and soybean meal volumes to set records • Wild Cards • China soybean demand • U.S. production prospects • 2014 • Key Developments • Soybean volume rises on record sales to China • Soybean meal and oil volume up on stronger demand
Export Outlook for Cotton • Initial FY 2015 Projection: $4.1 Billion • Revised FY 2014 Forecast: $4.7 Billion Up $300 Million 2015 Key Developments • Import demand slows further • Prices fall on record stocks • Wild Cards • Additional changes in China’s reserve policy • Cotton yarn demand in China • 2014 • Key Developments • Unit values remain strong as prices fell
Export Outlook for Dairy, Livestock, and Poultry • Initial FY 2015 Projection: $32.9 Billion • Revised FY 2014 Forecast: $33.4 Billion $1.2 Billion 2015 Key Developments • Beef higher as elevated prices outweigh lower shipments on tight supplies • Dairy lower on increased global competition • Pork lower on decreased prices and supplies • Poultry lower on reduced broiler meat shipments • Wild Cards • PED impact • Ongoing SPS trade issues • 2014 • Key Developments • Gains in most categories, especially dairy
Export Outlook for Horticulture Products • Initial FY 2015 Projection: $37.0 Billion • Revised FY 2014 Forecast: $34.1 Billion Unchanged 2015 Key Developments • Long-term growth trend continues • Strong exports to Canada, Europe and China • Tree nut exports higher due to strong demand in China and Europe for almonds, pistachios and walnuts • Wild Cards • China’s continued growth, particularly for tree nuts, fresh fruit and wine