Download
1 / 14
140 likes | 232 Views
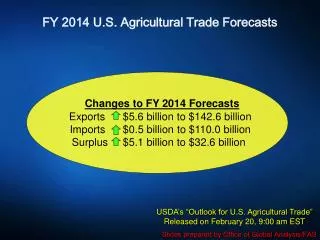
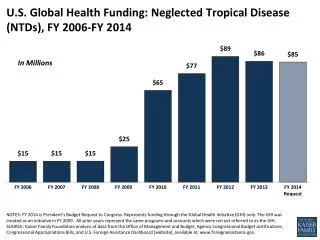
This report presents changes to US agricultural trade forecasts for FY 2014, highlighting the surge in soybean exports but fall in corn export values. The USDA's "Outlook for U.S. Agricultural Trade" released on December 2, showcases a trade surplus increase to $27.5 billion. Key developments in various sectors and wild cards influencing trade are analyzed in this comprehensive report.

E N D
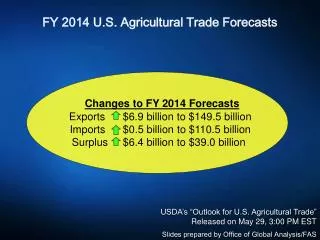
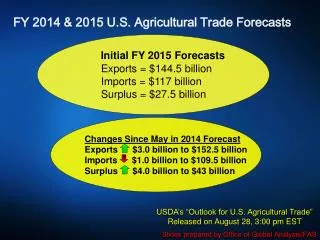
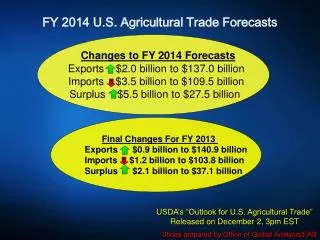
FY 2014 U.S. Agricultural Trade Forecasts Changes to FY 2014 Forecasts Exports $2.0 billion to $137.0 billion Imports $3.5 billion to $109.5 billion Surplus $5.5 billion to $27.5 billion Final Changes For FY 2013 Exports $0.9 billion to $140.9 billionImports $1.2billion to $103.8 billionSurplus $2.1 billion to $37.1billion • USDA’s “Outlook for U.S. Agricultural Trade” • Released on December 2, 3pm EST • Slides prepared by Office of Global Analysis/FAS
U.S. Agricultural Trade • Soybean exports surge on higher volumes and prices while corn export values fall 140.9 137.4 137 • Records 109.5 Exports 42.9 37.1 • Imports • Trade Surplus
Higher soybean exports outweigh lower grains and cotton • November vs. August Commodity Forecasts • +$0.7 Billion -$0.7 Billion +$2.4 Billion • No Change • November • August • -$0.7 Billion
Lower Grains, Oilseeds, and Cotton Offset Gains in LPD and Hort • November FY 2014 Forecast vs. FY 2013 Exports • +$3.1 billion -$3.2 Billion +$0.3 Billion -$3.2 Billion • FY 2013 • FY 2014 • -$1.3 Billion
Bulk Exports Continue to Slide While High Value Products Nearing Record $ 46.2 Billion $ 94.7 Billion $ 94.1 Billion $ 42.9 Billion
Export Volume Recovers 166 mmt 146 mmt 130 mmt *Includes cotton, rice, soybean meal, soybean oil, beef & veal, pork, beef and pork variety meats, broiler meat, and tobacco
Canada and China Vie for Top Market Status Canada Mexico China
Exports Up to China and Mexico Change in FY 2014 Exports from August Forecast +$100 mil +$100 mil +$100 mil +$1.0 bil -$100 mil +$600 mil +$200 mil -$100 mil
FY 2014 Imports • Imports are forecast at a record $109.5 billion – down $3.5 billion from the Aug. forecast Imports $3.5 billion but remain at a record of 109.5 billion Tropical Products$1.7 billion– lower imports of coffee , rubber, cocoa, and sugar Horticultural Products$300 million – demand forfresh fruits and vegetable, processed fruit, wine, and essential oils continues growth Grain and Oilseeds $1.5 billion –sharply lower U.S. demand for imported corn Livestock & Dairy $500 million–lower beef and dairy imports expected
Export Outlook for Grain & Feed Products Revised FY 2014 Forecast: $28.1 billion $700 million 2014 Key Developments • Wheat volume down–less demand from China and Brazil and competition from Canada. • Wheat value down -pressured by record U.S. corn crop. • Corn value is down slightly, despite sharply higher volumes. • Record U.S. corn crop is pressuring unit values, spurring global import demand. Wild Cards • South American corn plantingprogress • Southern Hemisphere winter wheat crops • China’s wheat and corn import demand
Export Outlook for Oilseeds & Products Revised FY 2014 Forecast: $28.8 Billion $2.4 Billion 2014 Key Developments • Soybean volume rises on record early sales and larger production • Strong demand boosts soybean and soybean meal prices • Soybean meal volume up on record sales pace • Soybean oil exports reduced on weakening vegetable oil prices and strong domestic demand for biofuels Wild Cards • China’s soybean import demand • Argentina export prospects
Export Forecast for Cotton Revised FY 2014 Projection : $4.3 Billion $700 million 2014 Key Developments • Lower unit values • More exportable supply in major competators Wild Cards • China’s reserve policy
Export Outlook for Dairy, Livestock, and Poultry Revised FY 2014 Forecast: $31.8 Billion $700 Million 2014 Key Developments • Pork raised on higher prices with strong Asian demand expected • Beef raised on higher prices with strong global demand and limited supplies • Dairy higher on strong prices and increased export volumes. • Broiler meat lowered slightly on lower prices. Wild Cards • Ongoing SPS trade issues
Export Outlook for Horticulture Products Revised FY 2014 Forecast: $34.5 Billion Unchanged 2014 Key Developments • Long-term growth trend continues • Strong exports to Canada, Europe and China • Tree nut exports higher due to strong demand in China and Europe for almonds, pistachios and walnuts Wild Cards • China’s continued growth, particularly for tree nuts, fresh fruit and wine • Record