Download
1 / 38
380 likes | 532 Views
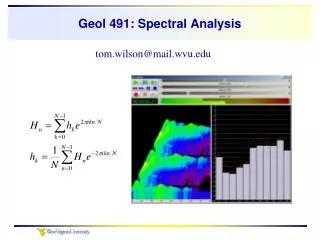
Geol 491: Spectral Analysis. tom.wilson@mail.wvu.edu. Purpose of the class. Explore ways of introducing some advanced mathematical concepts to students in such a way as to increase their interest in higher level math. To learn new and useful analytical tools. To have fun!. Grade.

E N D
Geol 491: Spectral Analysis tom.wilson@mail.wvu.edu
Purpose of the class Explore ways of introducing some advanced mathematical concepts to students in such a way as to increase their interest in higher level math. To learn new and useful analytical tools To have fun!
Grade • Computer lab assignments – 30% • Lesson plan development (2 teams): initial and final drafts, 10% each for 20% of the semester grade • Class presentation 30% • Final report: revision of lesson plan with discussion of what additional activities you think would be useful to undertake. 20% • Final report should include a brief half page to page discussion of what you got out of the class. Was it useful? Why or why not?
Fourier said that any single valued function could be reproduced as a sum of sines and cosines Introduction to Fourier series and Fourier transforms 5*sin (24t) Amplitude = 5 Frequency = 4 Hz seconds
We are usually dealing with sampled data 5*sin(24t) Amplitude = 5 Frequency = 4 Hz Sampling rate = 256 samples/second Sampling duration = 1 second seconds
Faithful reproduction of the signal requires adequate sampling If our sample rate isn’t high enough, then the output frequency will be lower than the input,
The Nyquist frequency is equal to one-half of the sampling frequency. The Nyquist frequency is the highest frequency that can be measured in a signal. The Nyquist Frequency Where t is the sample rate Frequencies higher than the Nyquist frequencies will be aliased to lower frequency
The Nyquist Frequency Thus if t = 0.004 seconds, fNy = Where t is the sample rate
Periodic functions and signals may be expanded into a series of sine and cosine functions Fourier series: a weighted sum of sines and cosines
This applet is fun to play with & educational too. Experiment with http://www.falstad.com/fourier/
Try making sounds by combining several harmonics (multiples of the fundamental frequency) An octave represents a doubling of the frequency. 220Hz, 440Hz and 880Hz played together produce a “pleasant sound” Frequencies in the ratio of 3:2 represent a fifth and are also considered pleasant to the ear. 220, 660, 1980etc. Pythagoras (530BC)
You can also observe how filtering of a broadband waveform will change audible waveform properties. http://www.falstad.com/dfilter/
The Fourier series can be expressed more compactly using summation notation Fourier series You’ve seen from the forgoing example that right angle turns, drops, increases in the value of a function can be simulated using the curvaceous sinusoids.
Try the excel file step2.xls Fourier series
A transform takes one function (or signal) in time and turns it into another function (or signal) in frequency This can be done with continuous functions or discrete functions The Fourier Transform
The general problem is to find the coefficients: a0, a1, b1, etc. The Fourier Transform Take the integral of f(t) from 0 to T (where T is 1/f). Note =2/T What do you get? Looks like an average! We’ll work through this on the board.
Getting the other Fourier coefficients To get the other coefficients consider what happens when you multiply the terms in the series by terms like cos(it) or sin(it).
Now integrate f(t) cos(it) This is just the average of i periods of the cosine
Now integrate f(t) cos(it) Use the identity If i=2 then the a1 term =
What does this give us? And what about the other terms in the series?
In general to find the coefficients we do the following and The a’s and b’s are considered the amplitudes of the real and imaginary terms (cosine and sine) defining individual frequency components in a signal
Arbitrary period versus 2 Sometimes you’ll see the Fourier coefficients written as integrals from - to and
Exponential notation cost is considered Re eit where
A transform takes one function (or signal) and turns it into another function (or signal) Continuous Fourier Transform: The Fourier Transform
A transform takes one function (or signal) and turns it into another function (or signal) The Discrete Fourier Transform: The Fourier Transform
We’ll do some work with mp3 files. See http://soundmachine.gooddogie.com/sounds4.htm
Tiger.mp3 Amplitude versus time on the sound track
Spectral plots Classic view Low to high frequency content in the sound file as a function of time
Various spectral views under windows>classic, vertical, horizontal
Design spectral filters to see how sounds change when certain frequencies are removed. Try this with a recording of your own voice Try filtering everything out above 375 Hz Get a view of the spectrum
http://www.falstad.com/fourier/ Fourier series java applet http://www.jhu.edu/~signals/ Collection of demonstrations about digital signal processing http://www.ni.com/events/tutorials/campus.htm FFT tutorial from National Instruments http://www.cf.ac.uk/psych/CullingJ/dictionary.html Dictionary of DSP terms http://jchemed.chem.wisc.edu/JCEWWW/Features/McadInChem/mcad008/FT4FreeIndDecay.pdf Mathcad tutorial for exploring Fourier transforms of free-induction decay http://lcni.uoregon.edu/fft/fft.ppt This presentation Some useful links
Meeting times? Other questions?