Download
1 / 35
390 likes | 743 Views
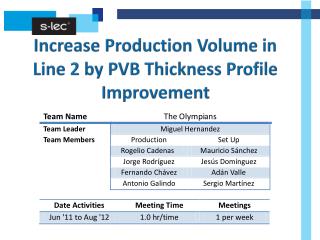
Team Name. The. Olympi. ans. Team Leader. Miguel Hernandez. Team Members. Production. Set Up. Rogelio Cadenas. Mauricio Sánchez. Jorge Rodríguez. Jesús Domínguez. Fernando Chávez. Adán Valle. Antonio Galindo. Sergio Martínez.

E N D
Team Name The Olympi ans Team Leader Miguel Hernandez Team Members Production Set Up Rogelio Cadenas Mauricio Sánchez Jorge Rodríguez Jesús Domínguez Fernando Chávez Adán Valle Antonio Galindo Sergio Martínez IncreaseProductionVolume in Line 2 by PVB ThicknessProfileImprovement
1. Background In Sekisui S-Lec Mexico (SSM) we produce and sale PVB film for laminated glass. Windshields Automotive Industry PVB Film 56 to 142 cm 120 or 250 m 0.76 to 0.80 mm Widht: Length: Thickness: Safety glass Architectural Industry
1. Background PVB Production Line Extruder Annealing Moisture EndDie 1P 2P RZV WindingMachine Zone EmbossingRolls The PVB film process has severalsteps. Eachstep has different roll temperatures and speeds. ColdRolls WarmRolls
1. Background SSM Overview We have a continue production volume increase minimizing bottle necks. Maximumfeedingcapacity has beenreached. 4
1. Background TheorethicalWeightCalculation We produce in kilograms, but we sell in square meters PVB film Width Roll Example: Thickness Lenght 250 m Width 1.0 m Thickness 0.760 mm Length
1. Background Efficiency Calculation in a Standard 24 hr Production Day Raw Material (Kg) Total theoritical weight (Kg) Winding Speed (m/min) Total Rolls (Quantity) Efficiency (%) 12,412 10.0 57 82.7 RESIN 14,895 12.0 69 99.3 15,000 Kg CIZER
2. Need of Kaizen CompanyPolicy: MaintainourProfitability. Safety isfirst. PlantPolicy: IncreaseProductionVolume in 5 % 5%
3. Situation before Kaizen SSM has several kaizen themes in process
3. Situation before Kaizen As a qualityrequirementthe PVB Thicknessisevaluated in 2 dimensions: 1) Crosswise thickness Range that we call R1 µm EXAMPLE cm Max 785 Min 752
3. Situation before Kaizen 2) Lenghtwise thickness Range called R2, wich is measured in three zones called: North (N), Center (C) and South (S) N NORTH SAMPLE C µm S 789 Max 752 Min R2 = 37.0 µm Specification: R2: Max 50 microns Average = 770.5 µm cm
3. Situation before Kaizen µm Excessive Raw Materials Excessive Raw Materials Ideal thickness Lack of Raw Materials cm Quality Improvement: We can assure that PVB will keeps the same performance along the roll. Efficiency Improvement: Reducing the thickness Range but keeping the same Average.
3. Situation before Kaizen R1 ProcessCapabilityAnalysis R2 Process Capability Analysis
4. Target Increase 3% the monthly average of production volume of the first half of the year µm Improve R1: -10% vs 2011 Specification: Max 35 microns µm Improve R2: -15% vs 2011 Specification: Max 50 microns
6. Analysis R1: Root Causes Identification. Method Machinery Materials AnnealingZoneSpeed Ratios Profile Humidity 1PR Temperature High Low Registration Variation Variation along the roll Registration Standardization Variation Standardization Variation Higher Temperature Chemicalcharacteristics Die Lip Die TemperatureProfile High Low Die vs 1PR Distance Low feeding profile Speed in rolls Longer than manual R1 variation Variation Calibration Training Temperature Equipment Variation Moisture Tolerance SettingTemperature Variation Standardization No especificated Communication Measurement Environment Man power
6. Analysis R2: Root Causes Identification. Method Machinery Materials Humidity 1PR Temperature AnnealingZoneSpeed Ratios Profile High Low Registration Variation Variation along the roll Higher Variation Standardization Registration Variation Temperature Chemicalcharacteristics High Low Standardization 1 PR vs 2PR Speed Ratios Profile Die vs 1PR Distance Speed in rolls Longer than manual R2 variation Variation Calibration Training Temperature Equipment Lack to measure R2 Variation Moisture Tolerance Setting ratios Variation Standardization No especificated Measurement Environment Man power
6. Analysis R1 & R2: Root Causes Identification. DIE 1P 2P ANNEALING ZONE
7. Actions 1.- CommunicationProcess (dailymeeting) • Create a teamworkenvironment • All areas involved in thickness profile improvement process
7. Actions End Die front view 2.- R1: End Die Gap Profile y temperatureprofile The End die is where the PVB film is formed, here the thickness is adjusted in two ways: Adjust Gap bolt 1.- By adjusting the lip gap with bolts, thightening or loosening them. PVB entry Lip 2.- By adjusting the heating temperature of plate heaters. End Die top view Plate Heaters PVB entry Adjust Gap bolt
7. Actions 2a.- R1: Improve GAP Profile of LipEnd Die North Center South
7. Actions 2b.- R1: Improve control of temperatureprofile in End Die North Center South Reduce temperaturetomakestiffer film and reduce deformationsduetherollersspeed. R1= 24 µm R1= 26 µm
7. Actions 3.- R1 & R2: Improvetemp. Profile in 1P Upper Roll. Previous Condition Current Condition Δ = 12°C Δ = 5°C 51°C 60°C 63°C 51°C 52°C 56°C R1= 24 µm R1= 20 µm
7. Actions 4.- R1 & R2: Reduce Temperature of Temperature Control Roll No. 1 (TCR 1) 2 PR 1 PR TCR 1 EndDie Heating Pipe Roll 5 m/min 10 m/min R1= 20 µm R1= 19 µm R2= 39 µm R2= 37 µm
7. Actions 5.- R1 & R2: Reduce temperaturevariation of 1P Rolls. InletWater 1P rolls Outlet Water • CHECK: • Small diameter of connection pipes. • Wrongconnection of hoses. • ACTION: • Increasesize of diameterconnection pipe. • Rightconnection • Plan new test.
7. Actions 6.- R2: WrongDistance Die vs 1PR Previous Condition Current Condition Through reduce the distance between 1PR and Die, minimize the deformation of the Melted PVB (PVB hottest temperature in the production process). R2= 34 µm R2= 37 µm
7. Actions 7.- R2: Speedand ratios profile in AllRolls DifferentSpeeds & Temperatures Winding machine m/min m/min m/min Annealingzone 2PR ExcessivePull and Loosemovements produce deformationonthethicknessprofile End die 1PR RZV Rolls Moisturezone Windingspeedincreased 12 to 13 m/min 1P rolls. PVB deformationcausedpulling m/min m/min m/min ColdRolls WarmRolls 26
7. Actions 7a.- R2: Speedand ratios profile in AllRolls m/min Winding machine m/min m/min m/min Annealingzone 2PR End die 1PR RZV Rolls Moisturezone m/min m/min m/min R2= 34 µm R2= 27 µm ColdRolls WarmRolls
8. Results Previous Condition: High Variations of PVB Thickness Lengthwise Thickness Profile N C S Current Condition: Flatter/Constant PVB Thickness, better Quality N C S
8. Results R1 ProcessCapabilityAnalysis R2 Process Capability Analysis
8. Results R1 Average Performance vs Target Kaizen Target: 23 R2 Average Performance vs Target Kaizen Target: 30
8. Results R1 & R2 vs SpeedComparison 1P roll temp. Control Ratio 1P & R2 Improving die gap control, bolt & temp. Installheating pipe. µm m/min Adjustspeed AZ & windidng
8. Results Real + 109.7 Ton + 3.7 % vs 2011 Target 3.0% Target isreached!!
8. Results Aditional Benefits a) More production volume with same raw material quantity give us major production efficiency. %
9. Prevention & Standardization Standardize the GAP of the lip of the Die in the Set-up Instruction Sheet. Standardize Rolls speed profile verifying once per day and adjust if needed. Standardize Rolls temperature identifying and adjusting in case of variation. 10. Future actions ContinuereducingR2, new target 18 microns. Define rollersspeedprofilebasedonthewidth of the PVB. Reduce crosswisethicknessaverageprofilewithbigger roll sizes .
Do you have any question? Thank you!