Download
1 / 28
280 likes | 433 Views
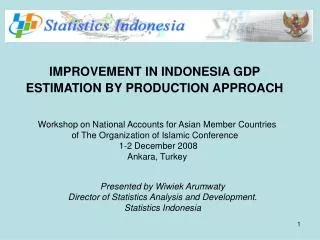
IMPROVEMENT IN INDONESIA GDP ESTIMATION BY PRODUCTION APPROACH. Workshop on National Accounts for Asian Member Countries of The Organization of Islamic Conference 1-2 December 2008 Ankara, Turkey. Presented by Wiwiek Arumwaty Director of Statistics Analysis and Development.

E N D
IMPROVEMENT IN INDONESIA GDP ESTIMATION BY PRODUCTION APPROACH Workshop on National Accounts for Asian Member Countries of The Organization of Islamic Conference 1-2 December 2008 Ankara, Turkey Presented by Wiwiek Arumwaty Director of Statistics Analysis and Development. Statistics Indonesia
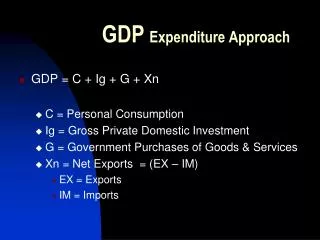
A brief about Indonesian GDP • Approaching: • Production side (Industrial sectors) • Expenditure side • Periods: • Annually • Quarterly (Calendar year) • Locations: • National level • Regional level (Provincials and Municipality) 30 provincials, 450 municipalities
Base Year: • 1960, 1973, 1983, 1993 and 2000 • Classification: • Production side (9 sectors, 58 sub-sectors, about 200 commodities and commodity groups) • Expenditure side (6 components) • Source of data: • Primary data • Secondary data (Administration data provided by various of institution) • Basic data produced: • Output minus Intermediate Input = Value Added • Current and Constant estimation • Data derivation: nominal value, economic structure, economic growth, deflator (price changes), and per-capita
The Chronology • Since 1962 the (BPS-Statistics Indonesia) institutionalized compiling the National Income Statistics of Indonesia annually, supervised by United Nations • In 1962 the first publication of Indonesian “National income” data released which covering the period of 1958-1962 classified by industrial origin at current and constant 1960 prices. • In 1966 BPS produced comprehensive publication presenting data instead of GDP, GNP also on net domestic product (NDP), by using constant 1960 prices. (classified into 11 production sectors)
In 1967 BPS published the second publication covering the period of 1960-1964 in the same format and system of presentation as the first ones. Instead of presenting by national language (bahasa Indonesia) the publication also presents a brief description in English. • in 1970 entitled “National Income” of Indonesia covering period 1960-1968 more elaborating the gross domestic product (GDP) categorized by industrial origin as well as expenditure, both at current and constant 1960 prices. • In 1973, the latest national income publication which using constant 1960 prices was the third publication covering the years 1968-1973.
In 1980, a new series of Indonesian GDP was estimated by using 1973 as the base year. Both industrial sectors as well as expenditure were classified to its components accordingly (9 production sectors and 6 components expenditure) • The publication entitled main tables of National Income of Indonesia 1973-1979. The series described concepts and definitions of macro economic aggregate, analyzed the structural changes and sectoral growth. • The format of this series of “national income” statistics continued to be published by BPS until the period of 1979-1983.
The implementation of Five-year Development Planning Programs facilitate BPS to adjust and change benchmark year estimate from constant prices 1973 to be 1983. • In 1984, BPS published the series of Indonesia National Income, with the 1983 as a new benchmark year. The series of that statistics covering the years of 1983-1993 • Following the commitment on every 10 years as base year cycle, 1993 has been chosen as a new base year for the series of national income statistics covering periods 1988-1995. • From 1997 to 1999 was the Indonesian economic crisis era. The performance of macro economic condition in that period was so worth which also reflected on national accounts data as well as GDP
In 2001, after the economic crisis era a new series of GDP was estimated by using 2000 as the constant prices. Various basic data and information on economic statistics was collected to support the estimation of GDP showing the economic recovery process. • In the meantime quarterly GDP data become an importance information. In line with compilation on annual GDP, quarterly base also estimated to present the economic phenomenon periodically and consistently . • The latest publication of GDP uses 2000 as new base year available covering data series 2000-2007, while quarterly GDP release data until Q III-2008.
About GRDP (Gross Regional Domestic Products) • Since 1970’s there has been a growing interest to study on regional economic in Indonesia. In August 1970 BPS and the Faculty of Economic University of Indonesia in Jakarta took initiative to coordinate and establish the professional societies organization which is called Regional Income Research Group (RIRG). • This situation stimulate BPS and its branch offices was coordinating data collection, formulating the standard methodology and carried out special surveys and studies to support the estimation of Regional Product in every Province in Indonesia
For the first time in 1973 BPS published the Gross Domestic Product of the Region (GRDP) of 17 Provinces in Indonesia covering data for 1969-1971. This publication present GRDP of the provinces classified by industrial origin (sectoral side) both at current and constant 1969 prices. • Periodically BPS also published the GRDP of all provinces in Indonesia by industrial origin and by expenditure category compiled from individual province publication, followed by the GRDP of regencies (provincial) and Municipalities (kabupaten/kota).
Estimating GRDP at constant prices in every province/municipality has also been adjusted to the national benchmark year 1983, 1993 and then 2000. This will facilitate the analysis and comparative study of regional economy in Indonesia. • The latest publication on the regional income in Indonesia, 2000-2006, one year lag published after the national GDP published. • Nowadays, BPS branch offices in the province take an important role in the development of regional economic studies supported by Regional Development Plan of Local Government and Universities in the region.
Data improving process • Various studies and special surveys related to economic indicators conducted by BPS and other institutions, as well as availability of up-to-date data from various sources complemented the methodology improvement used to estimate the Indonesian GDP in current and constant price • Each sector/sub-sector/commodities has its own approach/method used to estimate the output as well as the value added. Basically most data on volume, price, input structure, used to estimate the value added, but some activities using the administration data (financial report) such as: financial sectors (banks, insurance, leasing, pawnshop, stock exchange etc.) including data on government income and expenditures.
The computation methodology for a particular variable may change relating to the availability of data sources • Improving not only on the quantity data but also quality such as data on volume, price, input structure and other information relating on GDP (ex: coverage of the estimation, distribution process ) • As new data sources become available then old ones are eliminated. When only partial data are available, any such information and supplement data used to complete the estimation. • Before annual GDP data available, the quarterly GDP for various commodities is estimated for the relevant quarter to support the figure
The years which I-O table was constructed (2005 is the newest ones), value added in GDP will be estimated base on it. I-O table only compiled once every five years (1971, 1975, 1980, 1985, 1990, 1995, 2000, and 2005) • Revision of estimation data provided on each publication categorized into its phase estimation: preliminary, very preliminary & fixed figures • Plausibility checks are conducted for estimates at both production side as well as expenditure side, both for national and regional data on GDP
“Gaps/Inconsistencies data” • The total of GDP from production side (Y) > than the total GDP from expenditure side (E) leads to discrepancy statistics • GDP (National) > than Σ GRDP (both provinces and municipalities) which estimated independently leads to political debate • Previously estimation of Value added on GDP < Value added in the I-O Table (except for the year 2005 and the years after)
Conclusions • Under supervision of United Nations (UNSD and ISWGNA), Indonesian GDP has been compiled since 1960 until now periodically • In line with the production approach (sectoral side), GDP from expenditure approach also developed due to have the whole information on economic perfomance • Several base years has been applied anticipating the economic structural changes and its behavior • Instead of annually figure the Indonesian GDP and GRDP (provinces only) also estimated on quarterly basis (since 2000)
In supporting GDP on the National level, simultaneously GRDP also estimated for the regional level (33 provinces and 450 municipalities) • Various studies and special surveys related to economic statistics indicators have been done, as well as up-to-date data availability from the sources, • Reviewing and improving the methodology used on GDP and GRDP both in current and constant price estimation has been done regularly • Neither annual GDP nor quarterly GDP publications do not give a specification type of value added components. Estimated every 5 years for the whole economy as well as various of sectors separately.
Table Input-Output data used to improved the quality of Indonesian GDP since the balancing of Supply and Demand could be controlled. I-O table showing the Interrelationship of industries in an economy with respect to the production and uses of their products. • Starting in 2005 the value added derived from I-O table has similar with the value added estimated in GDP • It is to be noted, that not all of the SNA’93 concept recommended might be used to improve the quality of Indonesian GDP. In 2000 improving data was focused on research and development products and Information Technology products (soft ware and networking) which included as part of the output of business sector.
Indonesian GDP (current and constant 2000 prices), 1990-2007 PDB ADHB PDB ADHK
Per-capita GDP (constant 2000, incl and excl Oil). 2000-2007
Provincial Poverty Distribution in 2007 000 person