Download
1 / 13
130 likes | 212 Views
Explore temperature, salinity, density, Chl-a, and dissolved oxygen profiles in shallow and deep tidal lines. Analyze velocity plots for different layers and directions.

E N D
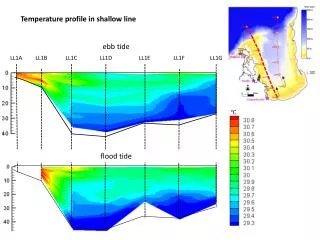
Temperature profile in shallow line ebb tide LL1A LL1B LL1C LL1D LL1E LL1F LL1G ℃ flood tide
Salinity profile in shallow line ebb tide LL1D LL1E LL1F LL1G LL1A LL1B LL1C flood tide
Density profile in shallow line ebb tide LL1D LL1E LL1F LL1G LL1A LL1B LL1C kg/m3 flood tide
Chl-a profile in shallow line ebb tide LL1D LL1E LL1F LL1G LL1A LL1B LL1C ppb flood tide
Dissolved oxygen profile in shallow line ebb tide LL1D LL1E LL1F LL1G LL1A LL1B LL1C mg/l flood tide
Temperature profile in deep line ebb tide LL2A LL2B LL2C LL2D LL2E LL2F ℃ flood tide
Salinity profile in deep line ebb tide LL2A LL2B LL2C LL2D LL2E LL2F flood tide
Chl-a profile in deep line ebb tide LL2A LL2B LL2C LL2D LL2E LL2F ppb flood tide
Dissolved oxygen profile in deep line ebb tide LL2A LL2B LL2C LL2D LL2E LL2F mg/l flood tide
Longitudinal Line1 flood tide (first layer) LL1B Velocity plot mm/s Horizontal axis: East-West direction velocity Vertical axis: North-South direction velocity LL1C LL1D mm/s mm/s LL1F LL1E mm/s mm/s
Longitudinal Line1 flood tide (bottom layer) LL1B Velocity plot Horizontal axis: East-West direction velocity Vertical axis: North-South direction velocity LL1C LL1D mm/s mm/s LL1F LL1E mm/s mm/s
Longitudinal Line2 ebb tide (first layer) LL2A Velocity plot mm/s Horizontal axis: East-West direction velocity Vertical axis: North-South direction velocity LL2B LL2C mm/s mm/s LL2E LL2D mm/s mm/s
Longitudinal Line2 ebb tide (bottom layer) LL2A Velocity plot mm/s Horizontal axis: East-West direction velocity Vertical axis: North-South direction velocity LL2B LL2C mm/s mm/s LL2E LL2D mm/s mm/s