Download
1 / 56
560 likes | 668 Views
State of the Southeast. Duane Vinson Vice President Client Services STR. Agenda. Current State of Lodging Group vs. Transient A Look at the Southeast & Market Recovery Forecast. Demand Rebounding Strongly…Room Rates not so quickly. Group Room Rates Still Suppressed

E N D
State of the Southeast Duane Vinson Vice President Client Services STR
Agenda • Current State of Lodging • Group vs. Transient • A Look at the Southeast & Market Recovery • Forecast
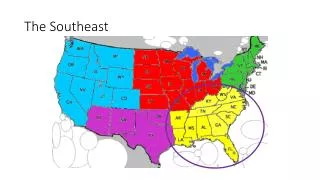
Demand Rebounding Strongly…Room Rates not so quickly. Group Room Rates Still Suppressed New Supply Muted in 2011 & 2012 Recovery will not be the same for all Markets Takeaways
% Change Hotels 51k Room Supply 1.8 bn 1.6% Room Demand 1.0 bn8.2% Occupancy 58% 6.4% A.D.R. $98.42 1.1% RevPAR $57.08 7.6% Room Revenue $100.6 bn 9.4% Total US - Key Statistics12-Months Ending February 2011
Strongest Demand Rebound Ever. Supply Line Turning 8.2% 1.6% -0.9% - 4.7% • 6.9% *Total US, Supply & Demand % Change, 12 MMA 1989 – Feb 2011.
Hotel Demand Directionally Following GDP GrowthTotal US Hotel Rooms Sold vs. GDP - Quarterly Change GDP Demand 2011 Smith Travel Research, Inc. Note: Percentage change is current quarter vs. same quarter last year (GDP in 2005 dollars) Source: BEA
Hotel Demand Directionally Following GPDI GrowthTotal US Hotel Rooms Sold vs. GPDI - Quarterly Change GPDI Demand 2011 Smith Travel Research, Inc. Note: GPDI is Gross Private Domestic Investment – the amount of GDP generated by business investment. Percentage change is current quarter vs. same quarter last year (GDP in 2005 dollars) Source: BEA
Is weaker demand a response to higher fuel prices? Average Fuel Price Room Demand *Total US Demand % Change vs. Avg. Fuel Prices, 2007– Feb 2011
Lowering fares stimulates more room demand or Increase fares because more people are traveling. U.S. Domestic Air Fares Room Demand *Total US Quarterly Demand % Change vs. US Domestic Airfares, 1996 – 2010
Demand Leads ADR, But Swings Get More Extreme 8.2% 1.1% -0.2% -0.9% -4.6% -4.7% -6.9% -8.1% *Total US, ADR & Demand % Change, 12 MMA 1989 – Feb 2011
Absolute ADR Will Not Recover for At Least 2 Years 30 Months -$8.74 41 Months -$3.70 * Total U.S., ADR, 12 MMA, Jan ’00 – Feb ‘11
ADR growth continues to be sluggish *Total U.S. Occupancy and ADR Percent Change 2010 through 3/19
All Regions posting stronger ADRs and improved RevPAR Occupancy:▲ 6.1% ADR:▼ Flat RevPAR:▲6.1% Occupancy:▲ 8.2% ADR:▲ 0.5% RevPAR:▲ 8.6% Occupancy:▲ 7.7% ADR:▲ 1.9% RevPAR:▲ 9.9% Occupancy:▲ 4.9% ADR:▲ 1.6% RevPAR:▲ 6.7% Occupancy:▲ 6.9% ADR:▲ 1.6% RevPAR:▲ 8.5% Occupancy: ▲ 6.0% ADR: ▲ 4.1% RevPAR:▲ 10.4% Occupancy:▲ 6.1% ADR:▲ 0.5% RevPAR: ▲ 6.7% Occupancy: ▲ 5.3% ADR: ▲ 0.2% RevPAR:▲ 5.4% Occupancy:▲ 6.3% ADR:▼ Flat RevPAR: ▲ 6.4% TOTAL US Occupancy:▲ 6.4% ADR:▲ 1.1% RevPAR:▲7.6% 12-Month Ending February 2011
In 2010 weekday occupancy recovery, now weekend catches up Weekday vs. Weekend Occupancy Percent Change12 Months Ending February 2011
Despite strong weekday demand in 2010, ADR is slow in returning Weekday vs. Weekend ADR Percent Change 12 Months Ending February 2011
Group vs. Transient Performance Customer Segmentation: Transient – Third party, rack rate, government rate, etc. Group – Rooms booked in blocks of 10 or more.
Transient Demand is Back… Millions Monthly Transient Demand 2007 Through February 2011 NOTE: Data is for upper tier hotels only (luxury chains, upper upscale chains, and upper tier independent hotels).
…but Transient ADR is not! Monthly Transient ADR 2007 Through February 2011 NOTE: Data is for upper tier hotels only (luxury chains, upper upscale chains, and upper tier independent hotels).
Group Demand Still Below ’07 & ‘08 Monthly Group Demand 2007 Through February 2011 NOTE: Data is for upper tier hotels only (luxury chains, upper upscale chains, and upper tier independent hotels).
A Rough Road Ahead for Group ADR Monthly Group ADR 2007 Through February 2011 NOTE: Data is for upper tier hotels only (luxury chains, upper upscale chains, and upper tier independent hotels).
Low Transient Rate will hold Group Rate Hostage U.S. Transient vs. Group Monthly ADR ($) January 2005 – February 2011 NOTE: Data is for upper tier hotels only (luxury chains, upper upscale chains, and upper tier independent hotels).
Transient ADR premium ranges from >$24 to <$3 Actual ADR ($) by Customer Segment Year to Date December 2007-2010, YTD Feb 2011 NOTE: Data is for upper tier hotels only (luxury chains, upper upscale chains, and upper tier independent hotels).
Development Pipeline – SETTRA StatesRooms Source: STR/McGraw-Hill Construction Dodge Pipeline
Total United StatesMarkets with Most Rooms In ConstructionFebruary 2011
Supply % Change 12M Ending Feb 2011 -3.2% 3.1 to 5.5% 2.1 to 3.0% 0.1 to 2.0% -3.2% to Flat 5.5%
Demand % Change 12M Ending Feb 2011 9.1 to 24.8% 6.1 to 9% 4.1 to 6% 2.5 to 4% 2.5% 24.8%
Occupancy % Change 12M Ending Feb 2011 8.1 to 23% 4.1 to 8.0% 0.1 to 4% -1.3% to Flat -1.3% 23%
ADR % Change 12M Ending Feb 2011 0.1 to 4.8% -2 to 0% -4 to -2.1% -6.2 to -4.1% 4.8% -6.2%
Major SETTRA Markets > 20,000 Rooms OCC % Myrtle Beach New Orleans Knoxville Orlando Charlotte ADR % Miami-Hialeah Baltimore Atlanta Raleigh-Durham-Chapel Hill Norfolk-VA Beach Tampa-St Pete Nashville Ft Lauderdale Jacksonville Richmond- St Petersburg Memphis Occupancy & ADR % Change 12M Ending Feb 2011
The Woodworth Theorem: “In the later part of a recovery demand is pushed out to the suburbs”
Indeed! Suburban Demand Grows Faster Now. • SETTRA States - Demand % Change by Location Type, 12 MMA, Jan’ 09 – Feb ’11 • Urban vs. Suburban/Interstate/Small Town/Metro
Why? Because Urban OCC has Recovered to pre-recession levels… 62.9 60.6% 54.9% 53.7% • SETTRA States - OCC % by Location Type, 12 MMA, Jan’ 09 – Feb ’11 • Urban vs. Suburban/Interstate/Small Town/Metro
… And Suburban ADRs Are Still At a Discount to 2009 • SETTRA States - ADR % Change by Location Type, 12 MMA, Jan’ 09 – Feb ’11 • Urban vs. Suburban/Interstate/Small Town/Metro
So: As Urban Hotels Stop Discounting, Demand Shifts To Suburban Hotels. • SETTRA States - Demand & ADR % Change by Location Type, 12 MMA, Jan’ 09 – Feb ’11 • Urban vs. Suburban/Interstate/Small Town/Metro
Secondary SETTRA Markets, 10,000-20,000 Rooms OCC % Biloxi-Gulfport Shreveport Charleston, SC Daytona Beach W Palm Beach-Boca Raton Chesapeake-Ocean City Mobile ADR % Jackson Savannah Greensboro- Winston Salem Columbia Little Rock Greenville-Spartanburg Birmingham Fort Myers Occupancy & ADR % Change 12M Ending Feb 2011
Tertiary SETTRA Markets, 5,000-10,000 Rooms OCC % Chattanooga Fayetteville, NC Asheville Lafayette Macon/Warner Robbins Montgomery Huntsville Bristol-Kingsport Tallahassee ADR % Hilton Head/Beaufort Panama City Pensacola Melbourne-Titusville Augusta Baton Rouge Wilmington Sarasota-Bradenton Fayetteville, AR Athens/ Gainesville, GA Lafayette Lakeland-Winter Haven Columbus/Lagrange Fort Walton Beach Occupancy & ADR % Change 12M Ending Feb 2011
Resort Demand Leads Rate Growth by Six Months, Very Different from the last Downturn 8.7% 6.2% .6% -2.3% -6.1% -11.4% -15.8% *SETTRA States – Resort Locations, ADR & Demand % Change, 12 MMA Jan ‘00 – Feb ‘11
High end leisure travel rebounding faster than budget conscious leisure 7.6% 5.2% -6.3% -6.5% *SETTRA States – Luxury/Upper Upscale/Upscale Class vs. Upper Midscale/Midscale/Economy Class, Resort Locations, Demand % Change, 12 MMA Jan ‘05 – Feb ‘11
Decline for luxury leisure ADR was faster & deeper than mid/economy; with a near identical rate of recovery 8.3% 7.5% 0.4% 0.1% -6.8% -10.5% *SETTRA States – Luxury/Upper Upscale/Upscale vs. Upper Midscale/Midscale/Economy Class, Resort Locations, ADR % Change, 12 MMA Jan ‘05 – Feb ‘11
Total United StatesDevelopment Pipeline – RoomsChange From Last Year
2011: The Year of The Hotel “Flasher” Super deals that are time sensitive, flashy and EVERYWHERE!