Download
1 / 34
340 likes | 383 Views
Explore long-term climatic trends in Estonia, focusing on drought indices and extreme weather conditions. Data analysis, methods, and results presented in relation to precipitation, temperature, and more.

E N D
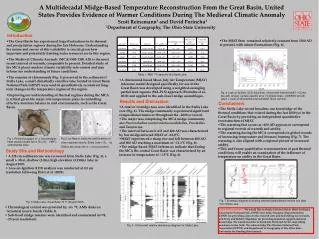
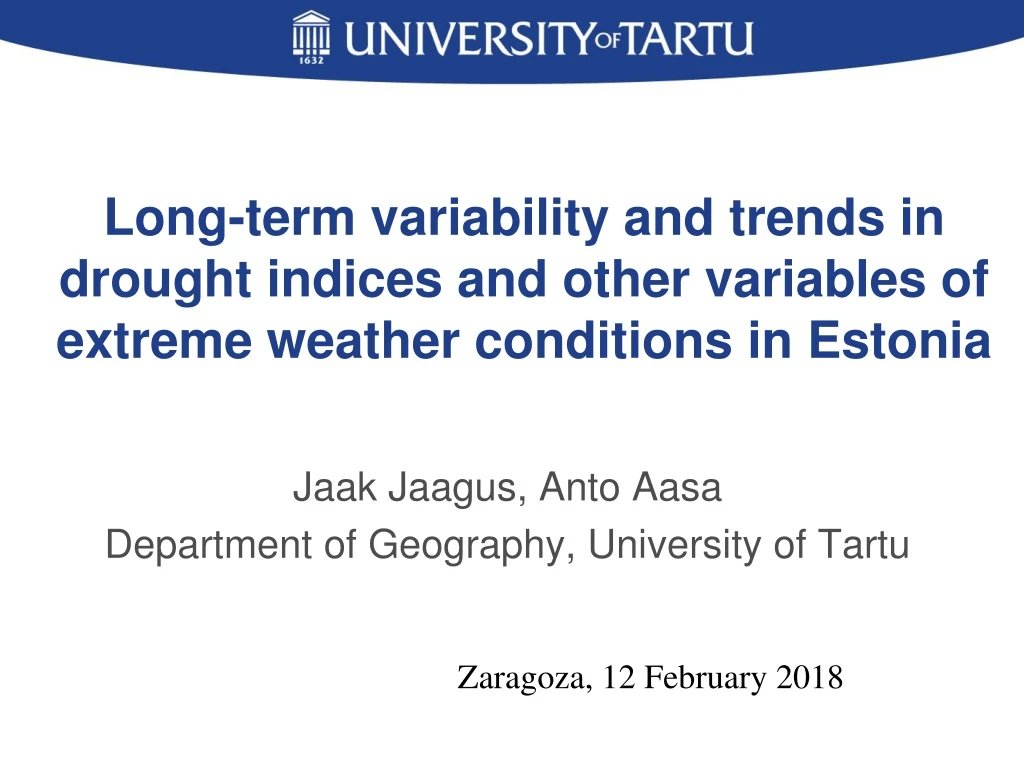
Long-term variability and trends in drought indices and other variables of extreme weather conditions in Estonia Jaak Jaagus, Anto Aasa Department of Geography, University of Tartu Zaragoza, 12 February 2018
IMDROFLOOD activities in the University of Tartu • Climatological analysis of long time series of river runoff at different regions in Estonia • Analysis of drought conditions in Estonia using the SPI and SPEI • Preparation of data for hydrological modelling of one sub-basin of Emajõgi River: Väike-Emajõgi River, runoff measurements at Tõlliste station • Preparation of the IMDROFLOOD Newsletter
Objective • To analyse variability and trends in time series of drought indices (SPI, SPEI) in Estonia during 1951-2015 • To present long-term variability in main climatic variables and indices of extreme weather conditions in Estonia based on measurements in Tartu
Initial data • Monthly precipitation, mean wind speed, relative humidity, solar radiation, sea-level pressure, and monthly mean daily maximum and minimum temperatures in 1951-2015 • 9 stations in Estonia: Vilsandi (since 1959), Ristna, Pärnu, Kuusiku, Tallinn, Võru, Tartu, Jõgeva and Tiirikoja • Monthly, annual and seasonal mean values • Daily mean temperature and monthly precipitation in Tartu in 1866-2015
History of the meteorological station in Tartu • 2 December 1865 – foundation of the Meteorological Observatory of the University of Tartu, which was situated at different locations • Tiigi 10 and Tiigi 1 (Senffi trepid) • From 1893 at Tiigi 15 (Tiigi Seltsimaja) • From 1926 at J. Liivi 3 (State Archives), closed on 1 March 1952 • Meteorological station at Tartu airport in Ülenurme since June 1949 • Station at Tartu Observatory in Tõravere since 1997
Homogeneity problems in precipitation measurements • Rain gauges with different diameter: initially 1000 cm2, since 1871 500 cm2 • From 1895 gauges with the Nipher shield • From 1950 Tretyakov gauges • Adding of the wetting correction 0.2 mm since 1966 • Automatic weather stations were installed in September 2003 • Manual measurements were continued in Tartu station
Methods • Calculating of monthly SPI and SPEI values using the special program in R • SPEI was found using three methods for the calculation of reference evapotranspiration: Penman-Monteith, Hargraves and Thorntwaite • Trend analysis of the time series using linear regression and Student’s t-test • Mann-Kendall test for trends, Sen’s method for calculating the slope
Variables of extremes • Severity of winter • Mean temperature in Dec-Feb and Nov-Mar • Sum of negative degree-days • Number of days with negative daily mean temperature • Annual 10th percentile of daily mean temperatures • Annual minimum daily mean temperature • Onset of spring • Mean temperature in Mar-May, in April and May • Onset of the growing season (the permanent incease of daily mean temperature above +5°C)
Variables of extremes • Summer droughts and excessiveprecipitation • Summer (Jun-Aug) mean and monthlymeantemperatures • Sumofactive (>+10°C) temperatures • Durationofthegrowingseason • Annual 90th percentile of daily mean temperatures • Summer (Jun-Aug) and monthlyprecipitationamounts • Annualmaximummonthlyprecipitation • Indicesofprecipitationextremesbased on dailyprecipitationin 1948-2015 (annual 90th, 95th and 99th percentilesofdailyprecipitation, maximum 5-days precipitation, annualmaximumdailyprecipitation) • Hydrothermal coefficient HTC = P / (0.1 × Σ Td), where P – precipitation, Td – daily mean temperature
Results • Precipitation is the main factor determining moisture conditions in Estonia. Trends in precipitation are reflected in trends of the drought indices • During the cold period (Nov – Mar) increasing trends in SPI and SPEI have been detected in all stations but they are statistically significant not at all stations • Stronger changes were detected in the eastern Estonia while weaker trends were typical in western Estonia near to the Baltic Sea • The highest trend values were obtained for SPEI using the method by Penman-Monteith
Results • During the warm season (Apr – Oct) statistically significant positve trends revealed only in June that correspond to similar trends in precipitation • These changes in June were strong in the coastal stations and for SPEI (Penman-Monteith) • Weak positive changes were detected in October • Negative changes i.e. drying was found in April in eastern Estonia, and in some stations in July and September • This was detected in case of SPEI Hargraves and Thorntwaite but not in Penman-Monteith and SPI
Results • No trends in May and August • General increasing trends in annual SPI and SPEI • Increasing tendency in spring SPI but not in spring SPEI • Positive trend in summer SPI and SPEI (Penman-Monteith) in Tiirikoja and Pärnu but no trends in summer SPEI Hargrave and Thorntwaite • Weak increase in SPI and SPEI in autumn, which is significant in Tartu, Pärnu and Tiirikoja in case of SPEI (Penman-Monteith)
Results on winter extremes in Tartu in 1866-2015 • General warming in winter: winter mean temperature has increased by ca 2°C during the 150 years • Annual 10th percentile of daily mean temperatures has increased by 2.7°C • Sum of negative degree-days has decreased by ca 248°C, number of days with negative mean temperature has decreased by 33 days • Only the increase in annual minimum daily mean temperature by 1.5°C is statistically insignificant
Results on winter extremes • The coldest winter was observed in 1871 (-13.1°C), the warmest 2008 (+0.2°C) • The sum on negative degree-days has varied between 157 (2008) and 1479 (1942), the number of days with negative daily mean temperature between 45 (2015) and 167 (1875), and the annual 10th percentile of daily mean temperatures between -14.8 (1942) and -0.6 (2015)
Results on spring extremes • Mean temperature in spring (Mar-May) has increased significantly – by 2.3°C, as well as in all months • The onset of the growing season has shifted earlier by 15 days – the earliest on 27 March 2010, the latest on 25 May 1867
Results on summer temperature • No trends in summer temperature except August (warming by 1.1°C) • The sum of active temperatures has increased by 242°C, the end of the growing season has shifted 10 days later and its duration has increased by 25 days • No trend in the annual 90th percentile of daily mean temperatures
Results in summer precipitation • Theamount of summer (Jun-Aug) precipitationhasnotchangedduringthestudyperiod, but in Juneithassignificantlyincreased (by 17 mm) and in Julyinsignificantlydecreased (by 21 mm) • Themaximummonthlyprecipitationhas no trend • The indices of precipitation extremes have no trendsin 1948-2015 • HTC has no significanttrendsbutclearpositiveincrease in June and negative in July
Conclusions • Drought indices are determined by precipitation amounts, trends in precipitation are reflected in drought indices • Increasing trend in SPI and SPEI during the cold season (Nov – Mar) and in June • Decreasing of SPI and SPEI in some stations in April, July and September, no trends in May and August • Significant warming in winter and spring but not in summer and autumn, lengthening of the growing season • Generally no trends in precipitation during the warm season, only an increase in June