Download
1 / 21
220 likes | 319 Views
Effects of Streambed Periphyton on Hydraulics and Sediment Deposition in Streams. Nira Salant Department of Geography University of British Columbia. What is periphyton?. What does periphyton do?. Food and habitat. Physical effects?. I. Hydraulics. II. Sediment deposition.

E N D
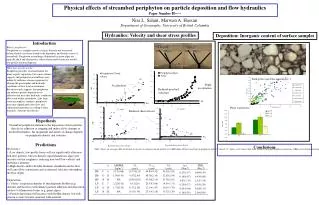
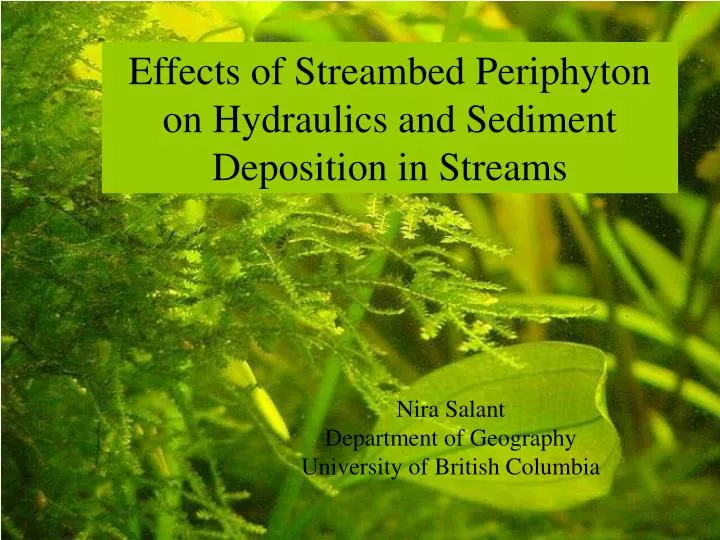
Effects of Streambed Periphyton on Hydraulics and Sediment Deposition in Streams Nira Salant Department of Geography University of British Columbia
What does periphyton do? Food and habitat Physical effects? I. Hydraulics II. Sediment deposition
Sediment deposition Algae: High profile Diatoms: ‘Sticky’ Turbulence Trapping, Adhesion,Clogging
Deposition from water column: Diatoms Diatoms: ‘Sticky’
6 7 6 5 5 4 4 Depsoitional velocity wd (cm/h) TKE shear stress (Pa) 3 3 2 2 1 1 0 0 0.0 2.0 4.0 6.0 8.0 10.0 12.0 AFDM(g/m2) Deposition from water column: Diatoms Depositional velocity Biomass increases: Near-bed shear stress increases (structural roughening) Max shear stress Near-bed shear stress Deposition velocity decreases (high upward stresses and infiltration decreases = ‘clogging’) Highest deposition velocity when near-bed and upper flow shear stresses are low and biomass is moderate (moderate adhesion, low clogging)
Deposition from water column: Diatoms Evidence for clogging?
Deposition from water column: Algae Algae: High profile
6 7 6 5 5 4 TKE shear stress (Pa) 4 Depositional velocity wd (cm/h) 3 3 2 2 1 1 0 0 0 5 10 15 20 25 30 AFDM(g/m2) Deposition from water column: Algae Deposition decrease with biomass? Clogging? Unclear relation between biomass, shear stress, and depositional velocity But…
6 7 25 7 6 6 5 20 5 5 4 15 4 4 Depositional velocity wd (cm/h) AM(g/m2) TKE shear stress (Pa) 3 3 3 10 2 2 2 5 1 1 1 0 0 0 0 0 5 10 15 20 25 0 5 10 15 20 25 Growth stage (Weeks) Growth stage (Weeks) Deposition from water column: Algae Max shear stress Shear stress increases with growth stage Surface samples AM Depositional velocity Surface deposition decreases with growth stage Near-bed shear stress Later growth stage Increase in shear stress Less surface deposition • BUT • Higher advection and infiltration (subsurface deposition) High biomass reduces infiltration Total deposition = balance of surface and subsurface deposition
Deposition from water column: Algae Turbulence Less surface deposition, deeper infiltration (A8 A20) Biomass Reduced infiltration despite high advection (A16)
Implications Flow conditions, sediment accumulation, interstitial infiltration Habitat condition Organism behavior Streambed patchiness and complexity …a function of periphyton structure and distribution
Decrease in concentration over time Exponential model C0 = peak concentration at time t = 0 k = decay (or deposition) rate (T-1) ws = settling velocity (D/T) = depositional velocity wdwhen fit to exponential model h = flow depth (D)
I. Hydraulics Filamentous periphyton ‘patches’ ‘Closed’ ‘Open’
umax Ux u0 0.6 0.0 10.0 20.0 30.0 40.0 50.0 50.0 u (cm/s) u (cm/s) Velocity distribution
Peak shear = top of Roughness layer Shear stress distribution Two-layered flow Closed Shift in height of roughness layer top Same thickness Logarithmic layer Periphyton Open No periphyton
Periphyton None 0.3 0.25 0.2 z/H 0.15 0.1 0.05 0 0 0.005 0.01 0.015 0.02 0.025 Re/ρUx2 ( Near-bed turbulence reduction 1) Shift in location of peak shear (Open mats) 2) Hydrodynamic smoothing (Closed mats) Reduced turbulent transfer Higher upper flow stress
None Diatoms 4 Weeks Diatoms 24 Weeks