Download
1 / 20
200 likes | 381 Views
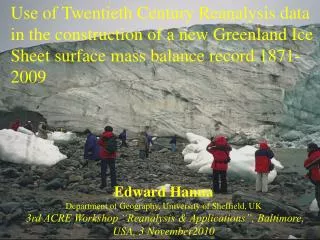
Use of Twentieth Century Reanalysis data in the construction of a new Greenland Ice Sheet surface mass balance record 1871-2009. Edward Hanna Department of Geography, University of Sheffield, UK 3rd ACRE Workshop “Reanalysis & Applications”, Baltimore, USA, 3 November2010. Co-contributors:.

E N D
Use of Twentieth Century Reanalysis data in the construction of a new Greenland Ice Sheet surface mass balance record 1871-2009 Edward Hanna Department of Geography, University of Sheffield, UK 3rd ACRE Workshop “Reanalysis & Applications”, Baltimore, USA, 3 November2010
Co-contributors: Roger Bales, Sierra Nevada Research Institute, University of California, USA; John Cappelen, Danish Meteorological Institute, Copenhagen, Denmark; Mike Griffiths, Corporate Information & Computing Services, University of Sheffield, UK; Philippe Huybrechts, Vrije Universiteit Brussel, Belgium; Tris Irvine-Fynn, University of Sheffield, UK; Joe McConnell, Desert Research Institute, Reno, USA; Deniz Savas, Corporate Information & Computing Services, University of Sheffield, UK; Konrad Steffen, CIRES, University of Colorado, USA.
Main objectives • (1) Present preliminary extended/recalibrated 1871-2009 reconstruction of Greenland Ice Sheet (GrIS) surface mass balance (SMB) based on merged Twentieth Century Reanalysis– European Centre for Medium-Range Weather Forecasts (ECMWF) ERA-40 climate reanalysis data time series; • (2) Show some details of validation and comparison against other recently published GrIS SMB time series.
Modelling the Greenland Ice mass Here we use interpolated+adjusted temperature and similarly interpolated precipitation data plus used a simple degree-day meltwater runoff model (Janssens & Huybrechts 2000, Annals of Glaciology) to reconstruct snow accumulation, surface meltwater runoff and surface mass balance of Greenland Ice Sheet on monthly and annual basis for last 130 years This modelling only requires surface air temperature, precipitation and evaporation (surface latent heat flux) data, plus modelled elevation and accurate reference digital elevation model, as inputs. Several different modelling approaches exist: most notably energy-balance models with dynamically-downscaled regional climate model data incorporating more model physics (e.g. Box, Fettweis, Van den Broeke) but these suffer from over-complexity and lack of data when trying to reconstruct Greenland Ice mass pre-satellite era. One weakness is that cloud cover over Greenland is very poorly known, which means the energy balance is poorly constrained.
Raw C20thR 2-m surface air temperature on 2 latitude x 2 longitude grid for January 1871; scale = -30 to +10 degC
Simple bilinear interpolation of SAT to 5x5-km grid – retains C20thR gross model errors; scale -30 to +10 degC
Surface air temperature interpolated to 5x5-km grid andadjusted for C20thR minus 5x5-km Ekholm (1996) DEM orography, using empirically-derived ice-sheet surface lapse rates; scale -30 to +10 degC
Surface (2m)-air-temperature July 2003-2009 anomalies based on ECMWF operational analysis downscaled to 5x5 km and corrected for orography errors. Note generally high anomalies around Greenland margins/ablation zone and low anomalies in the interior: a dichotomous response of Greenland temperatures to global warming? These plots redrawn courtesy of Dr. Tris Irvine-Fynn.
C20thR use in Greenland Ice Sheet surface mass balance modelling * Here used global 6-hourly surface climate fields spanning 1871-2008 from C20thR version 2 dataset downloaded from NCAR summer 2010. • Downscaled 2x2-degree data to 5x5-kilometre grid based on Ekholm (1996)/Huybrechts Greenland DEM. * C20thR precipitation evidently too high over Greenland - Gil Compo (pers. comm. 2009) advised that other climate modellers have found similar issues. Based on initial assumption that this is systematic bias, we calibrated C20thR precip as follows: (1) C20thR mean annual 1950-2006 precipitation scaled for each 5-km grid square to Bales et al. (2009) Greenland ice-core-/weather station-based “corrected precipitation” map (as reasonably long interval most representative of 1950-2006 period); (2) all C20thR annual precip values were then adjusted by this scaling factor; (3) Further rescaling of C20thR annual precipitation interannual variation against ECMWF precipitation variation to adjust for lower precip variance arising from lower spatial resolution in C20thR c/w ECMWF.
Bales et al. (2009) GrIS “corrected” precipitation minus evaporation map based on ice-core and weather-station data, which we use to rescale C20thR precipitationIncludes correction factors for gauge-catch biases (undercatch due to wind/snow) at coastal met. stations.
Greenland Ice Sheet 1870-2009 hybrid C20thR-ECMWF surface mass balance series calibrated to Bales et al. (2009) accumulation map
Conclusions • New Twentieth Century Reanalysis (C20thR) dataset is useful for extending GrIS SMB record back in time (->1871) but needs careful calibration/validation, which I’m doing as part of ACRE Working Group 3. • Evidence from historical ice-core annual accumulation data for several dozen locations on the ice sheet suggests statistically significant agreement if we tune modelled SMB to Bales (observation-based) accumulation map. Pending further in situ data, there is therefore no reason to favour RACMO (higher) SMB over Hanna et al. (lower) SMB reconstruction for common overlap period. However, cores mainly miss high precipitation/snowfall south-east Greenland coastal region: new/more validation data are urgently needed, as GrIS surface mass balance currently uncertain by >100 Gt yr-1; however, variation and trends are fairly well constrained. • GrIS SMB absolute values remain uncertain by >100 Gt yr-1, pending further validation data BUT variability/trends are much better constrained. .