Download
1 / 27
280 likes | 522 Views
Hypothesis testing Some general concepts: Null hypothesis H 0 A statement we “wish” to refute Alternative hypotesis H 1 The whole or part of the complement of H 0 Common case: The statement is about an unknown parameter, H 0 : H 1 : – ( )

E N D
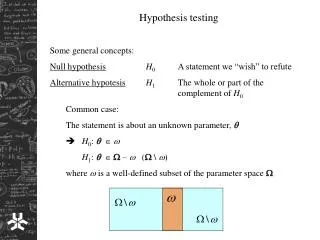
Hypothesis testing Some general concepts: Null hypothesisH0 A statement we “wish” to refute Alternative hypotesisH1 The whole or part of the complement of H0 Common case: The statement is about an unknown parameter, H0: H1: – ( \) where is a well-defined subset of the parameter space
Simple hypothesis: (or – ) contains only one point (one single value) Composite hypothesis: The opposite of simple hypothesis Critical region (Rejection region) A subset C of the sample space for the random sample X = (X1, … , Xn)such that we rejectH0 if X C (and accept (better phrase: do not reject ) H0 otherwise ). The complement of C, i.e. C will be referred to as the acceptance region C is usually defined in terms of a statistic, T(X) , called the test statistic
Simple null and alternative hypotheses Errors in hypothesis testing: Type I error Rejecting a true H0 Type II error Accepting a false H0 Significance level The probability of Type I error Also referred to as the size of the test or the risk level Risk of Type II error The probability of Type II error Power The probability of rejecting a false H0 , i.e. the probability of the complement of Type II error = 1 –
Writing it more “mathematically”: Classical approach: Fix and then find a test that makes desirably small A low value of does not imply a low value of , rather the contrary Most powerful test A test which minimizes for a fixed value of is called a most powerful test (or best test) of size
Neyman-Pearson lemma x = (x1, … , xn) a random sample from a distribution with p.d.f. f (x; ) We wish to test H0 : = 0 (simple hypothesis) versus H1 : = 1 (simple hypothesis) The the most powerful test of size has a critical region of the form where A is some non-negative constant. Proof: Se the course book Note! Both hypothesis are simple
How to find B ? If 1 > 0 then B must satisfy
If the sample xcomes from a distribution belonging to the one-parameter exponential family:
“Pure significance tests” Assume we wish to test H0: = 0 with a test of size Test statistic T(x) is observed to the value t Case 1: H1 : > 0 The P-value is defined as Pr(T(x) t | H0 ) Case 2: H1 : < 0 The P-value is defined as Pr(T(x) t | H0 ) If the P-value is less than H0 is rejected
Case 3: H1 : 0 The P-value is defined as the probability that T(x) is as extreme as the observed value, including that it can be extreme in two directions from H0 In general: Consider we just have a null hypothesis, H0, that could specify • the value of a parameter (like above) • a particular distribution • independence between two or more variables • … Important is that H0 specifies something under which calculations are feasible Given a test statistic T = t the P-value is defined as Pr (T is as extreme as t | H0 )
Uniformly most powerful tests (UMP) Generalizations of some concepts to composite (null and) alternative hypotheses: H0: H1: – ( \) Power function: Size:
A test of size is said to be uniformly most powerful (UMP) if If H0 is simple but H1 is composite and we have found a best test (Neyman-Pearson) for H0 vs. H1’: = 1 where 1 – , then if this best test takes the same form for all 1 – , the test is UMP. Univariate cases: H0: = 0 vs. H1: > 0 (or H1: < 0 ) usually UMP test is found H0: = 0 vs. H1: 0 usually UMP test is not found
Unbiased test: A test is said to be unbiased if ( ) for all – Similar test: A test is said to be similar if ( ) = for all Invariant test: Assume that the hypotheses of a test are unchanged if a transformation of sample data is applied. If the critical region is not changed by this transformation, the test is said to be invariant. Consistent test: If a test depends on the sample size n such that ( ) = n( ). If limn n( ) = 1 the test is said to be consistent. Efficiency: Two test of the pair of simple hypotheses H0 and H1. If n1 and n2 are the minimum sample sizes for test 1 and 2 resp. to achieve size and power , then the relative efficiency of test1 vs. test 2 is defined as n2 / n1
(Maximum) Likelihood Ratio Tests Consider again that we wish to test H0: H1: – ( \) The Maximum Likelihood Ratio Test (MLRT) is defined as rejecting H0 if • 0 1 • For simple H0, gives a UMP test • MLRT is asymptotically most powerful unbiased • MLRT is asymptotically similar • MLRT is asymptotically efficient
If H0 is simple, i.e. H0: = 0 the MLRT is simplified to Example
Sampling distribution of Sometimes has a well-defined sampling distribution: e.g. A can be shown to be an ordinary t-test when the sample is from the normal distribution with unknown variance and H0: = 0 Often, this is not the case. Asymptotic result: Under H0 it can be shown that –2ln is asymptotically 2-distributed with d degrees of freedom, where d is the difference in estimated parameters (including “nuisance” parameters) between
Wald tests Score and Wald tests are particularly used in Generalized Linear Models
Confidence sets and confidence intervals Definition: Let xbe a random sample from a distribution with p.d.f. f (x ; ) where is an unknown parameter with parameter space , i.e. . If SX is a subset of , depending on X such that then SX is said to be a confidence set for with confidence coeffcient (level) 1 – For a one-dimensional parameter we rather refer to this set as a confidence interval
Pivotal quantities A pivotal quantity is a function g of the unknown parameter and the observations in the sample, i.e. g = g (x ; ) whose distribution is known and independent of . Examples:
To obtain a confidence set from a pivotal quantity we write a probability statement as (1) For a one-dimensional and g monotonic, the probability statement can be re-written as where now the limits are random variables, and the resulting observed confidence interval becomes For a k-dimensional the transformation of (1) to a confidence set is more complicated but feasible.
In particular, a point estimator of is often used to construct the pivotal quantity. Example:
Using the asymptotic normality of MLE:s One-dimensional parameter : k-dimensional parameter :
Construction of confidence intervals from hypothesis tests: Assume a test of H0: = 0 vs. H1: 0 with critical region C( 0 ). Then a confidence set for with confidence coefficient 1 – is