Hypothesis-Testing Model-Complexity
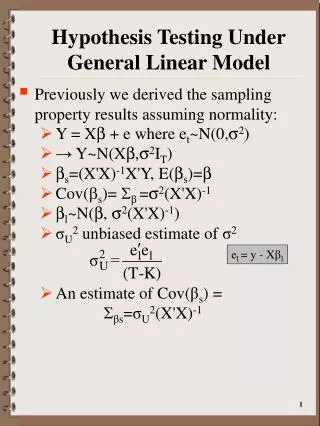
Hypothesis-Testing Model-Complexity. Hypothesis Testing …. Domain of groundwater model. …topographic contours. … a dam. … irrigated area. … channel system. … extraction bores. … native woodland. … observation bores. Supplied “from outside”. Inflow from uphill. Supplied “from outside”.

Hypothesis-Testing Model-Complexity
E N D
Presentation Transcript
Hypothesis-Testing Model-Complexity
Supplied “from outside” Inflow from uphill
Supplied “from outside” Inflow from uphill Groundwater interaction with rivers
Supplied “from outside” Inflow from uphill Groundwater interaction with dam Groundwater interaction with rivers
Supplied “from outside” Inflow from uphill Groundwater interaction with dam Leakage from channels Groundwater interaction with rivers
Supplied “from outside” Inflow from uphill Groundwater interaction with dam Leackage from channels Aquifer extraction Groundwater interaction with rivers
Supplied “from outside” Inflow from uphill Groundwater interaction with dam Leackage from channels Aquifer extraction Groundwater recharge Groundwater interaction with rivers
More often than not, a definitive model cannot be built. Recognize this, focus on the question that is being asked and, if necessary, use the model for hypothesis testing.
Remember that model calibration is a form of data interpretation. The whole modelling process is simply advanced data processing.
New Development CANE EXPANSION CURRENT
Increased cane production Leakage from balancing storage: 2.5 mm/d at calibration 2.5 mm/d for prediction 46R10P8
Increased cane production Leakage from balancing storage: 2.5 mm/d at calibration 2.5 mm/d for prediction 46R15P8
Increased cane production Leakage from balancing storage: 2.5 mm/d at calibration 2.5 mm/d for prediction Zone 17 absent 48R14P8
Increased cane production Leakage from balancing storage: 0.0 mm/d at calibration 0.0 mm/d for prediction 46R3P7
Increased cane production Leakage from balancing storage: 0.0 mm/d at calibration 0.0 mm/d for prediction 46R4P7
Increased cane production Leakage from balancing storage: 0.0 mm/d at calibration 0.0 mm/d for prediction Zone 17 absent 48R8P7
Increased cane production Leakage from balancing storage: 2.5 mm/d at calibration 2.5 mm/d for prediction 46R10P10
Increased cane production Leakage from balancing storage: 2.5 mm/d at calibration 2.5 mm/d for prediction 46R11P10
Increased cane production Leakage from balancing storage: 2.5 mm/d at calibration 2.5 mm/d for prediction Zone 17 absent 48R14P10
Simple Model P E Runoff M d Ks
Simple Model P E Runoff M d • M Soil Moisture Capacity (mm/m depth) • d Effective Rooting Depth • Ki Initital loss • fcap Field Capacity • Ks Saturated Hydraulic Conductivity Ks
Simple Model M P E Runoff M d • M Soil Moisture Capacity (mm/m depth) • d Effective Rooting Depth • Ki Initital loss • fcap Field Capacity • Ks Saturated Hydraulic Conductivity Ks
A probability contour:- “Fixing” a parameter p2 p1
A probability contour:- p2 This has the potential to introduce bias into key model predictions. p1
A probability contour:- p2 Also, what if this parameter is partly a surrogate for an unrepresented process? p1
A probability contour:- “Fixing” a parameter p2 p1
A probability contour:- “Fixing” a parameter p2 p1
Not only does uncertainty arise from parameter nonuniqueness; it also arises from lack of certainty in model inputs/outputs and model boundary conditions. The model can be used as an instrument for data interpretation, allowing various hypotheses concerning inputs/outputs and boundary conditions to be tested. Where did the idea ever come from that there should be one calibrated model?
modeller construction calibration prediction “the deliverable”
prediction “the deliverable”
prediction “the deliverable”
modeller construction calibration prediction