Download
1 / 21
210 likes | 285 Views
This paper presents a novel methodology for estimating upper limits of major cost drivers in profitable conceptual launch system architectures. The process allows quick estimations and evaluations to assess system profitability, utilizing cost charts to determine relationships and upper limits. The technique provides supplemental data for determining a concept's profitability and enabling ease of conformance to system objectives. The discussion includes the use of charts, assumptions, and tutorial exercises to understand the cost bounds of a profitable space transportation system.

E N D
SPACE TECHNOLOGY & APPLICATIONS INTERNATIONAL FORUM (STAIF -98)Conference on Next Generation Launch VehiclesE5 - Cost & Operations A NOVEL METHODOLOGY FOR ESTIMATING UPPER LIMITS OF MAJOR COST DRIVERS FOR PROFITABLE CONCEPTUAL LAUNCH SYSTEM ARCHITECTURES January 25-29, 1998 Albuquerque, N.M. RUSSEL RHODES/NASA RAYMOND BYRD/BOEING KENNEDY SPACE CENTER, FL.
A NOVEL METHODOLOGY FOR ESTIMATING UPPER LIMITS OF MAJOR COST DRIVERS FOR PROFITABLE CONCEPTUAL LAUNCH SYSTEM ARCHITECTURES Introduction: • Process enables "quick look" estimations and evaluations to effectively determine if a concept provides focus for leapfrog improvement (Relies on existing cost estimating tools for input) • A back of the envelope technique for fast, timely, on-the-spot, assessment of affordability (profitability) of commercial space transportation concepts • Cost Charts are provided to determine relationships and/or upper limits • Process will enable user to develop "cost and price per payload unit to orbit" supplemental to basic vehicle cost estimates for determining concept's ability to achieve system-profitability goals • Technique will allow architectural concept developer or user to easily determine concepts' conformance to system required objectives
COST Non-recurring cost Acquisition Cost Recurring Cost Acquisition Payback Cost Labor Cost Replacement Hardware Cost Propellant Cost PRICE Recurring Factors Debt Service Insurance Profit A NOVEL METHODOLOGY FOR ESTIMATING UPPER LIMITS OF MAJOR COST DRIVERS FOR PROFITABLE CONCEPTUAL LAUNCH SYSTEM ARCHITECTURESDiscussion on the Use of Charts and Assumptions That Apply to Each: PAYLOAD CAPACITY IS ASSUMED TO BE 20,000 LB. TO LOW EARTH ORBIT, IF PAYLOAD CAPACITY IS 2X ASSUMED, COST/UNIT TO ORBIT VALUES ARE 1/2 THOSE SHOWN; OR, IF PAYLOAD CAPACITY IS 1/2 ASSUMED, THE VALUES ARE 2X THOSE SHOWN
A NOVEL METHODOLOGY FOR ESTIMATING UPPER LIMITS OF MAJOR COST DRIVERS FOR PROFITABLE CONCEPTUAL LAUNCH SYSTEM ARCHITECTURES • Tutorial Exercise Using the Charts to Understand the Bounds for Major Cost Related to a Profitable Space Transportation System: ASSIGNED ASSUMPTIONS • Investment where recurring cost are controlled at $200/pound to orbit • Price controlled at $400/pound to orbit • One (1) Billion dollar vehicle investment for two (2) vehicles total • One (1) Billion dollar ground infrastructure investment • Labor cost goal @ 10% of total cost ($20/pound to orbit) • Replacement hardware cost goal @ 10% of total cost ($20/pound to orbit) • Propellant cost goal @ 10% of total cost ($20/pound to orbit) • Acquisition investment payback in 5 years • Flight rate @ 50 times per year per vehicle (100 flights/year total) • Vehicle payload delivery to orbit of 20,000 pounds each flight • Investment mony acquired at 20% simple interest for 5 years ($1 billion) • Insurance cost @ 1% vehicle investment exposed ($500 million/year)
A NOVEL METHODOLOGY FOR ESTIMATING UPPER LIMITS OF MAJOR COST DRIVERS FOR PROFITABLE CONCEPTUAL LAUNCH SYSTEM ARCHITECTURES • Assessment From The Charts: • From the acquisition chart for 5 year payback, yields $100/pound to orbit and left $100/pound for other operating costs • Infrastructure investment by Spaceport and charged through fees • Labor, replacement hardware, and propellant cost = $60/pound to orbit • Debit service accounts for $1billion over 5 yrs. or $100/pound to orbit which leaves $100/pound to cover insurance • Profit was a loss of $110/pound because insurance cost of $250/pound to orbit • Limit vehicle cost to 1/2 of assigned ($250 million/each) and check • Now acquisition chart for 5 years payback yields $50/pound to orbit • Debit service now is $1/2 billion over 5 years or $50/pound to orbit • Total operating cost is $110/pound to orbit • Insurance cost $125/pound to orbit plus debit service of $50/pound • Gross income would be $400 - 285 = $115/pound to orbit (reasonable?) High !
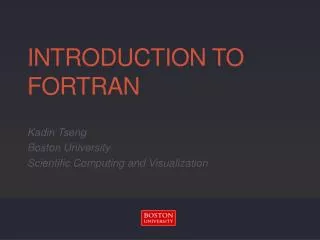
$1600/lb to orbit $400/lb to orbit $800/lb to orbit $200/lb to orbit 0 1B 2B 3B 4B 5B 6B 7B $100/lb to orbit • TOTAL ACQUISITION COST - $ BILLIONS • Sum of principal + simple interest = 0.5Pr+0.5In $50/lb to orbit 0 40 80 120 160 200 240 280 320 360 FLIGHTS /YEAR FIGURE 1c. Total Acquisition Cost @ 20 % & 5 year payback
$1600/lb to orbit $800/lb to orbit $400/lb to orbit $200/lb to orbit $100/lb to orbit 0 8B 16B 24B 32B 40B 48B 56B • TOTAL ACQUISITION COST - $ BILLIONS • Sum of principal + simple interest = 0.33Pr+0.67In $50/lb to orbit FLIGHTS/YEAR FLIGHTS /DAY 0 200 400 600 800 1000 1200 1400 1600 1800 0 1 2 3 4 5 FIGURE 1d. Total Acquisition Cost @ 20 % 10 year payback
$400/lb to orbit $800/lb to orbit $200/lb to orbit $100/lb to orbit $50/lb to orbit $1600/lb to orbit 0 2B 4B 6B 8B 10B 12B 14B • TOTAL ACQUISITION COST - $ BILLIONS • Sum of principal + simple interest = 0.33Pr+0.67In 0 40 80 120 160 200 240 280 320 360 FLIGHTS /YEAR FIGURE 1b. Total Acquisition Cost @ 20 % & 10 year payback
$400/lb to orbit $800/lb to orbit $200/lb to orbit $100/lb to orbit $50/lb to orbit $1600/lb to orbit 0 2B 4B 6B 8B 10B 12B 14B • TOTAL ACQUISITION COST - $ BILLIONS • Sum of principal + simple interest = 0.5Pr+0.5In 0 40 80 120 160 200 240 280 320 360 FLIGHTS /YEAR FIGURE 1a. Total Acquisition Cost @ 10% & 10 year payback
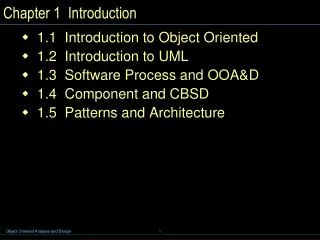
500 1000 2000 4000 6,000 12,000 24,000 48000 $20,000/lb to orbit (Early 1990's Shuttle curve) $5,000/lb to orbit (Early 1990's KSC ops contractor curve) MANPOWER (HEADCOUNT) ANNUAL LABOR COST - $ MILLIONS $80/lbto orbit $40/lbto orbit $20/lbto orbit $10/lbto orbit $5/lbto orbit 24 47 94 188 375 750 1500 3K 1.95 3.9 7.8 15.6 31.2 62.5 125 250 0 40 80 120 160 200 240 280 320 360 FLIGHTS/YEAR FIGURE 2a. Recurring Labor Cost @ $ 40/hr average rate
to orbit to orbit 25% or $50/lb 20% or $40/lb to orbit (Assumed Operations Cost @ $200/lb to orbit) 0 64 128 192 256 320 384 15% or $30/lb ANNUAL PROFIT- $ MILLION to orbit 10% or $20/lb 0 40 80 120 160 200 240 280 320 360 FLIGHTS/YEAR
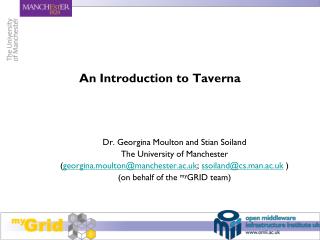
to orbit to orbit 25% or $200/lb 20% or $160/lb to orbit 0 256 512 768 1024 1280 1536 (Assumed Operations Cost @ $800/lb to orbit) 15% or $120/lb ANNUAL PROFIT- $ MILLION to orbit 10% or $80/lb 0 40 80 120 160 200 240 280 320 360 FLIGHTS/YEAR
A NOVEL METHODOLOGY FOR ESTIMATING UPPER LIMITS OF MAJOR COST DRIVERS FOR PROFITABLE CONCEPTUAL LAUNCH SYSTEM ARCHITECTURES • Relationship of Orbiter Orbit Stay Time and Time Available for Non-scheduled Maintenance @ 50 flights per Year per Vehicle: • For 2 days in orbit each flight, would utilize 100 days a year • Leaves only 265 days for ground turn-around operations, including payload and propellant servicing and both scheduled & un-scheduled maintenance • Assuming an operational availability factor of 0.90, leaves 26.5 days per year, or an average of 12.7 hours per flight for un-scheduled maintenance • For (airline-like) 1/4 day in orbit each flight, would utilize 91.25 days a year • Leaves only 273.75 days for ground turnaround operations • Assuming an airline-like operational availability factor of 0.98, leaves 5.5 days per year, or an average of 21.7 minutes per flight for un-scheduled maintenance • High availability and minimum orbit stay time add synergistically to enable the promise of an operable and responsive (affordable) space transportation system
A NOVEL METHODOLOGY FOR ESTIMATING UPPER LIMITS OF MAJOR COST DRIVERS FOR PROFITABLE CONCEPTUAL LAUNCH SYSTEM ARCHITECTURES MAJOR COST DRIVER RELATIONSHIPS "1994" SHUTTLE BENCH MARKS • Total Program Budget $ 4,973.4 Million • Labor Cost $ 3,445.9 Million or Headcount of 37,147 FTE's • Hardware & Materials $ 1,527.4 Million $ 14,210/# to Orbit or $ 710.49 Million/Flight • Shuttle Operations Only $ 3,375.7 Million • Hardware & Materials $ 920.9 Million • Labor Cost $ 2,454.7 or Headcount of 28,461 FTE's • Labor • Total Program $ 3,445.9 Million or Headcount of 37,147 FTE's $ 9,846/# to Orbit or $ 492.27 Million/Flight • Shuttle Operations only $ 2,454.7 Million or Headcount of 28,461 FTE's $ 7,014/# to Orbit or $ 35.67 Million/Flight • Located @ KSC Labor Cost $ 637 Million or 8,657 FTE's $ 1820/# to Orbit or $ 91 Million/Flight • Launch Operations $ 503.5 Million or 7,547 FTE's • Orbiter Logistics $ 133.5 Million or 1110 FTE's • SSME Logistics $ 121.6 Million or 869 FTE's
A NOVEL METHODOLOGY FOR ESTIMATING UPPER LIMITS OF MAJOR COST DRIVERS FOR PROFITABLE CONCEPTUAL LAUNCH SYSTEM ARCHITECTURES MAJOR COST DRIVER RELATIONSHIPS "1994" SHUTTLE BENCH MARKS CON'T • Replacement Parts Support Labor "Covered Above" • $ 110.7 Million $ 316.29/# to Orbit or $ 15.8 Million/Flight • Orbiter $ 40.5 Million $ 133.5 Million or 1110 FTE's • SSME $ 41.4 Million $ 121.6 Million or 869 FTE's • Ground Systems $ 28.8 Million $ 12.2 Million or 219 FTE's • Propellants Support Labor "Covered Above" • $ 10 Million $ 6.6 Million or 60 FTE's $ 28.57/# to Orbit or $ 1.43 Million/Flight • Number of Launches Completed in FY-1994 • 7 Flights $ 9,645/# to Orbit or $ 482.24 Million/Flight = $ 3,375.7 Million