Download
1 / 24
240 likes | 412 Views
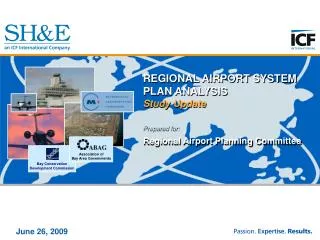
Association of Bay Area Governments. Bay Conservation Development Commission. REGIONAL AIRPORT SYSTEM PLAN ANALYSIS Study Update. Prepared for: Regional Airport Planning Committee. June 26, 2009. Meeting Topics. Recap of Historic and Forecast Bay Area Passenger Traffic

E N D
Association ofBay Area Governments Bay ConservationDevelopment Commission REGIONAL AIRPORT SYSTEM PLAN ANALYSISStudy Update Prepared for: Regional Airport Planning Committee June 26, 2009
Meeting Topics • Recap of Historic and Forecast Bay Area Passenger Traffic • Recent Changes in Airport Shares • Forecast of Future Distribution of Passengers at OAK, SFO, and SJC • Forecast of Aircraft Operations and Fleet Mix • Preliminary Capacity and Delay Analysis
Bay Area Airports Handled 58.6M Passengers Last Year After Peaking at 64M in 2000 Bay Area Passengers by Airport(Enplaned + Deplaned) Average Annual Growth1984-2008 2.6% 1984-2000 4.5% 2000-2008 -1.1% Source: ACI, and individual airport statistics.
Average Annual Growth Historic 1990-2007 2.0% Low BaseHighForecast 2007-2035 1.4% 1.9% 2.7% 128.8 101.3 88.2 60.6 Total Passengers at the Primary Bay Area Airport are Forecast at 88M to 129M in 2035 Actual and Forecast Total Bay Area Airport Passengers2007 and 2035 Source: SH&E analysis.
Development of a Forecast Tracking System is a Key Element of the Study • There is always uncertainty surrounding long-term forecasts of aviation demand. • This uncertainty is accentuated by current economic conditions. • A forecast tracking system will be developed to ensure that the expectations of RAPC and other stakeholders are informed by the latest trends in actual activity. • The tracking system will allow RAPC to adjust the timeline on which the region will reach critical capacity thresholds.
13.6 19.5 10.0 43.1 Domestic O&D Passengers Account for More Than Two-Thirds of Bay Area Airport Passengers Sources: Airport Data Reports. U.S. DOT, O&D Passenger Survey. U.S. DOT, T100 Database, Database Products Inc.
Geographic Distribution of Current Bay Area Demand – Domestic 2006 Bay Area Domestic PassengersOne dot represents 1,000 passengers Napa Napa Primary airport 1/ Share of Bay Area O&D passengersSource: MTC surveys and SH&E analysis Bay Area city
Distribution of Bay Area Domestic O&D Passengers byClosest Airport Closest Major Airport in Bay Area Region Closest Airport: Domestic O&D Passengers by Closest Airport Primary airport Bay Area city Source: MTC surveys and SH&E analysis
Over the Last Two Years, There Was a Major Shift of Domestic Traffic From OAK to SFO Airport Shares of Domestic O&D Passengers2006 vs. 2008 2006 2008 2006 2008 2006 2008 Oakland San Francisco San Jose Source: U.S. DOT Origin and Destination Survey, Airport Records, SH&E Analysis
In 2006, OAK’s Share of Domestic Passengers Equaled its “Closest Airport” Share – But Now It Captures Only 80% of Its Catchment Area Demand Comparison of Closest Airport Market Shares to Actual Airport Shares of Bay Area Domestic O&D Traffic2006 vs. 2008 Closest Airport 2006 2008 Closest Airport 2006 2008 Closest Airport 2006 2008 Oakland San Francisco San Jose Source: MTC Passenger Surveys, U.S. DOT O&D Survey, SH&E Analysis
A Perfect Storm of Events Led to the Significant Redistribution of Domestic Traffic Between the Bay Area Airports • Launch of Virgin America with SFO Base and Competitive Response of Southwest Airlines and JetBlue • Volatile Fuel Prices, a Global Recession, and Declining Passenger Demand • Carrier Financial Difficulties, Capacity Reductions, and Consolidation • Failure of ATA, Aloha, and Skybus (OAK) • Withdrawal of American Airlines and Continental • Capacity Reductions by Southwest and Alaska • Southwest (50% of SJC seats) increased seat capacity by 6% from 2006 to 2008 • Significant capacity reductions by other airlines, including American, Alaska and United At OAK: At SJC:
The Bay Area’s Domestic O&D is Highly Concentrated – the Top 15 Markets Account for 63% of the Total Bay Area Top Domestic O&D MarketsYE 3Q 2008 Source: U.S. DOT O&D Survey
Total Bay Area Top 15 Markets Aug 06 218 Jun 09 271 % Change +24.3% Daily Depts LCCs Greatly Increased SFO Services in the Top 15 Bay Area Domestic Markets, While LCC Flights Decreased at OAK and Held Constant at SJC Daily Departures by Low Cost Carriers in the Top 15 Bay Area O&D MarketsAugust 2006 and June 2009 -18.2% 0.0% +8.7x Aug’06 Jun’09 Aug’06 Jun’09 Aug’06 Jun’09 Oakland San Francisco San Jose Source: OAG Market Files
SFO Now Has LCC Services in 11 of the Bay Area’s Top 15 Domestic O&D Markets, Compared to Only Two Markets in 2006 Bay Area Top Domestic Market(Rank shown in parentheses) YE 3Q 2008 Seattle(5) Portland(12) Boston(13) New York(2) Chicago(7) Bay Area Washington(11) Denver* (10) Las Vegas (4) Burbank(8) Ontario (14) Los Angeles*(1) Orange Cty. (6) San Diego(3) Phoenix(9) Indicates LCC entry since August 2006 by B6, VX and/or WN * Indicates LCC service in August 2006 Dallas/Ft. Worth(15) Source: OAG Market Files, U.S. DOT O&D Survey
LCC Entry at SFO Reversed or Significantly Reduced Oakland’s Historic Fare Advantage ... Percent Oakland Average Fare Lower or Higher Than SFO4Q 2006 vs. 4Q 2008 Note: The 6 markets shown each has significant LCC carrier entry at SFO as of 4Q 2008. Source: U.S. DOT O&D Survey
… and had a Similar Effect at San Jose Percent San Jose Average Fare Lower or Higher Than SFO4Q 2006 vs. 4Q 2008 Note: The 6 markets shown each has significant LCC carrier entry at SFO as of 4Q 2008. Source: U.S. DOT O&D Survey
Oakland’s Share of Bay Area O&D Passengers Dropped Substantially in Top O&D Markets Oakland Share of Bay Area Selected MarketsCY2006 and YE3Q08 O&D Rank 1 2 3 4 5 7 Market Share Reductions also Occurred at SJC – but Were Less Severe Source: U.S. DOT O&D Survey
Reasons Why We Expect Oakland and San Jose to Rebound • The Oakland and San Jose Market Areas are Forecast to Grow More Rapidly than the San Francisco Market Area (based on Total Household Income) • The Current Competitive Battle at SFO is Not Sustainable and Will Eventually Subside • Ultimately the Three Airports will Move Toward Fare Parity in the Top Markets Where SFO Now Has Lower Fares (LAX, SAN, LAS, SEA)
Actual and Forecast Bay Area Airport Passenger Shares Domestic O&D Passenger Shares International Gateway Passenger Shares
Unconstrained Forecast of Total Passenger Traffic at the Primary Bay Area Airports - Base Case Actual and Forecast Passengers(in millions) Oakland San Francisco San Jose Note: Passenger traffic at Sonoma County Airport is forecast to increase from 205,000 in 2008 to 525,000 in 2020 and 784,000 in 2035 based on Airport Master Plan forecasts – Scheduled Air Carrier Dominant Scenario. Source: SH&E Analysis
From 2007 to 2035, Airport Passengers are Forecast to Increase by 1.2% to 2.2% Per Year Forecast Average Annual Growth in Airport PassengersBase Case (2007 to 2035) Note: San Francisco is forecast to grow the fastest because long-haul international traffic is forecast to grow faster than domestic traffic. Source: SH&E Analysis
The Average Number of Passengers per Flight is Forecast to Increase from 99 in 2007 to 126 in 2035 – Base Case Actual and Forecast Average Passengers per Operation Note: San Francisco's average passengers per flight reflects an increasing percentage of international traffic and services over the forecast period. Source: SH&E Analysis
Forecast Aircraft Operations at the Bay Area Airports – Base Case Actual and Forecast Aircraft Operations Source: SH&E Analysis
Preliminary Capacity and Delay Analysis • At 64 MAP in 2035, it is Clear that SFO Cannot Accommodate the Unconstrained Forecast • SJC’s Two Air Carrier Runways Can Readily Accommodate 16 MAP in 2035 • The Preliminary Capacity Analysis Indicates that OAK is Approaching its Single-Runway Capacity at 21 MAP • Finalization and Review of the Baseline Capacity Analysis Will Determine the Extent and Timing of the Region-Wide Capacity Shortfall