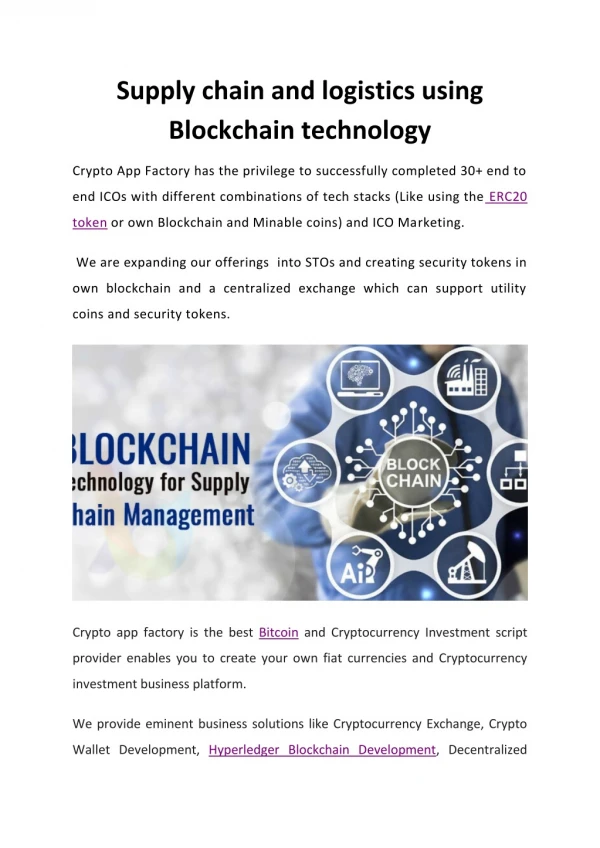
1 / 0

Using Portfolio and Supply Chain to Y our Advantage

Using Portfolio and Supply Chain to Y our Advantage. Thinking Strategically, Thinking Differently. Strategic Marketing Workshop. This session …. How do we build on what learn from state-of-the-art thinking on (i.e., additional considerations): Offering package and investment

mireya
Download Presentation

Using Portfolio and Supply Chain to Y our Advantage

An Image/Link below is provided (as is) to download presentation Download Policy: Content on the Website is provided to you AS IS for your information and personal use and may not be sold / licensed / shared on other websites without getting consent from its author. Content is provided to you AS IS for your information and personal use only. Download presentation by click this link. While downloading, if for some reason you are not able to download a presentation, the publisher may have deleted the file from their server. During download, if you can't get a presentation, the file might be deleted by the publisher.

E N D

Presentation Transcript


  1. Using Portfolio and Supply Chain to Your Advantage Thinking Strategically, Thinking Differently Strategic Marketing Workshop
  2. This session … How do we build on what learn from state-of-the-art thinking on (i.e., additional considerations): Offering package and investment Channel coordination and integration (SCM) Metrics – assessing strategy and marketing investment
  3. Vertical Incentive Alignment and Thinking Strategically – NCO, IMM,PBL, GoldCare and Beachhead Strategies

    How do we address our portfolio of offerings overall?
  4. A means of analysing the product portfolio and informing decision making about possible marketing strategies Originally developed by the Boston Consulting Group Links growth rate, market share, cash flow, profits The BCG or “Portfolio” Matrix
  5. Portfolio analysis provides a method of allocating scarce resources The growth share matrix is a common portfolio matrix High Market growth Low Low High Relative market share
  6. High Market growth Low Low High Relative market share The Y axis is market growth and the X axis is relative market share
  7. High Market growth Low High Low Relative market share Market growth is the Y axis: A low or high market growth is market specific Relative market share is the X axis: This is a reversed log scale going from low on the right to high on the left 10 1 0.1 High Low Relative market share
  8. The various quadrants are classified High Question Marks Stars Market growth Cash Cows Dogs Low Low High Relative market share
  9. High Question Marks Stars Market growth Cash Cows Dogs Low High Low Relative market share Question marks: are products or services in high growth markets but have a low market share relative to the competition Stars: are products or services in high growth markets that enjoy a high market share Cash Cows: are products or services in low growth markets but have a high market share Dogs: are products or services in low growth markets and have a low market share Types of managers …
  10. The ideal flow of resources is from the Cash Cows to the Question Marks to build Stars which become future Cash Cows High Question Marks Stars Market growth Cash Cows Dogs Low Low High Relative market share
  11. In order to draw a portfolio matrix you need: Market growth rates: The market or segment growth rates that each product, service or business unit is in. Your market or segment share: The percent of the market that your company controls in $ or in units. Your largest competitor's market share or segment share: The percent of the market your competitor controls in $ or units Total market size in revenue of units sold: For each market or segment what is its total size
  12. Calculate your relative market share in each market or segment by dividing your largest competitor’s market share into your own Seg 1 Seg 2 Seg 3 Seg 4 Your market share 20% 20% 20% 20% Largest competitor’s mkt. share 5% 10% 20% 40% Relative market share 4 2 1 0.5 2. Market growth rate 10% 20% 15% 5% 3. Size of each segment (in units) 15K 10K 20K 5K 4. Your market share in units 3K 2K 4K 1K
  13. The portfolio drawn using data from the previous page 25% Product 1 RMS = 4 Size = 3K growth = 10% 20% Product 2 RMS = 2 Size = 2K growth = 20% 15% Product 3 RMS = 1 Size = 4K growth = 15% Market growth 10% Product 4 RMS = 0.5 Size = 1K growth = 5% 5% 0% 10 1 0.1 Relative market share Toolkit software
  14. Adding a third dimension (Sustainable Competitive Advantage) to the portfolio matrix increases its power as a decision making tool
  15. Sustainable Competitive Advantage Develops a market or increases market size: the product or service brings an advantage such that a new market develops or the existing market expands. Increases market share: the product or service is unique enough that it gets more market share from the existing market. Decrease acquisition costs: the product or service brings the same level of service with a reduction in cost significant enough to attract new users to it. Decreases variable costs: the product or service allows customers to reduce the cost of doing business. Decreases fixed costs: the product or service reduces fixed costs. Increase peace of mind: the main competitive advantage is the peace of mind it delivers. Patent protection: can mean a less competitive market and often higher margins. Distribution network: some networks are valuable as products and services can quickly gain a large exposure. High service deliver and technical support: although not related being able to deliver the product on time or to remote locations and being able to service it are advantages difficult and costly for new competitors to emulate.
  16. 1. Corporate worldwide portfolio 2. Regional portfolio 3. Country portfolio 4. Sales territory
  17. Objective and consistent assessment of both market attractiveness and competitive position High Invest to scale and gain share Protect and expand leadership MarketAttractiveness Stop, run out or divest Manage for cash and extend Low Boeing Competitive Position Leader Follower A variation on a classic growth share matrix
  18. This session … How do we build on what learn from state-of-the-art thinking on (i.e., additional considerations): Offering package and investment Channel coordination and integration (SCM) Metrics – assessing strategy and marketing investment
  19. Aligning Incentives and “Asset Specificity” Other Industries: P&G / Wal-mart “Siemens One” John Deere Parts management Dealer conflict Apple versus Sony Ericsson Anheuser Busch distribution For Boeing: PBL (versus BMW) GoldCare (lessons from pharmaceuticals) 787 delays Other?
  20. Structure of Power within the Channel Incentive Compatibility and Alignment of Incentives Asset Specificity (joint investment short of a full merger/acquisition that aligns the incentives of both parties) Primary Considerations
  21. An Important Link to the Value Chain …
  22. This session … How do we build on what learn from state-of-the-art thinking on (i.e., additional considerations): Offering package and investment Channel coordination and integration (SCM) Metrics – assessing strategy and marketing investment
  23. Assessing Customer Needs, Comparing Options, Market Assessment and Metrics

  24. Think to future market strategies:

    How would you measure success?
  25. Imagine two future scenarios List the metrics that you would want to use in determining the success of where you invest future resources List these on a flipchart and be prepared to discuss the rationale for what you have chosen Short Table-Team Exercise:
  26. Mindset Product-Market Behavior Awareness Acquisition rate and cost Associations Complaints Attitude Customer Lifetime Value (CLV) Attachment (loyalty) Frequency Activity (word-of-mouth) Level of business spend Intentions Retention rate and cost Satisfaction Retention/repeat rate Willingness to pay Share of competition Typical Classic Customer Metrics
  27. Economic Value Added (EVA) Margins/Economic Profit Return on Investment/assets (ROI/ROA) Sales Stock return (MVA) Tobin’s q (total market value / total asset value) Typical (incremental) Financial Metrics
  28. Performance is multi-dimensional Short-term is different than Long-term Firms have multiple objectives/goals “Dashboard” to indicate a range of objectives and measures Latest Thinking
  29. ROI (ROMI) – net return divided by investment (more correctly, incremental profit as a ratio of the incremental expenditure) ROX
  30. Typical ROI measures used are NOT ROI: Incremental Sales Revenue Ratio of Costs to Revenue Cost per sale Cost of New Customer Acquisition Cost of Old Customer Retention Issues with ROX
  31. Accounting and finance: residual income rather than ROI is more appropriate. All other performance measures consider profit or cash flow after deducting expenses. At point of ROI maximization, additional sales will still earn profits (ROI max hit before profit max; ROI maximized when rate of new revenue exceeds costs, whereas profits are when the level exceeds costs). Incremental ROI measures requires baseline – what would have happened in the absence of spend? Does not generally include long-run impact (e.g., on Brand Equity) Issues with ROX
  32. Tend to be short-term oriented and reward short-term benefit at the expense of long-term gain Tends to lead to long-term under performance on all profit and growth metrics Measures the past, not the future In General, ROI Measures:
  33. Discounted Cash Flow Analysis Flows cash back to NPV and discounts future $ to the present Can be analyzed in terms of risks and variability, probability Cash flow of the past combined with probability analysis of the future can provide a more “balanced” perspective NPV, CLV, Brand Valuation and Customer Equity are all DCF techniques DCF (Discounted Cash Flow) Analysis
  34. “ROC equals a firm’s current period [net] cash flow from its customers plus any changes in the underlying customer equity, divided by the total customer equity at the beginning of the period” Peppers and Rogers 2005 ROC (Return on Customer)
  35. “Finally, a business metric that can drive better management and a higher stock price. I predict soon that you’ll be hard pressed to find a company that isn’t tracking ROC.” Larry Kudlow, host of CNBC’s “Kudlow and Company” (2005) ROC (Return on Customer)
  36. Bottom Line:

    “Dashboard” approach Issue is, unsatisfactorily, multidimensional DCF, ROC are both useful constructs Prospectively, probability-based tools may be necessary NPV, CLV, CE, DCF and ROC together as a concerted view of resource investment “success”
  37. This session … How do we build on what learn from state-of-the-art thinking on (i.e., additional considerations): Offering package and investment Channel coordination and integration (SCM) Metrics – assessing strategy and marketing investment
More Related