Download

1 / 25
280 likes | 583 Views
Basics of spatial statistics. EG1106: GI, a primer 12 th November 2004. Topics. Introduction The study of spatial statistics Some basic definitions Types of spatial data Methods of spatial analysis Practical Today. Introduction. Don’t be put off by the word ‘statistics”

E N D
Basics of spatial statistics EG1106: GI, a primer 12th November 2004
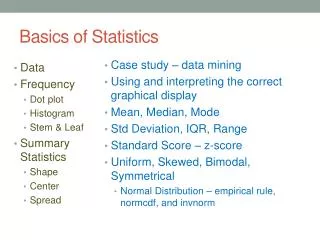
Topics • Introduction • The study of spatial statistics • Some basic definitions • Types of spatial data • Methods of spatial analysis • Practical Today
Introduction • Don’t be put off by the word ‘statistics” • As geographers (or environmental scientists) we are inherently interested in the spatial dependency of physical and/or human characteristics • We need to quantify the magnitude of this spatial dependency to understand it
The study of spatial statistics • SS is an area of study which has developed out of real-world problems • SS is a set of methods that are applied to data that are spatially correlated • Most SS methods operate on the premise that “data collected over a region in space found more close together are more highly correlated with each other than points further apart” (Cressie, 1991)
The study of spatial statistics • Underlying SS and spatial modelling is a coordinate space that enables measurements of distances and bearings between points according to formulas and functions • This model of space is known as Euclidean space • A 2-D model utilises a Euclidian plane
Some basic definitions • Regionalised variable: any variable distributed in space is said to be regionalised. Examples are: • Price of gold in NYSE (1 dimension) • Monthly rainfall (2 dimensions) • Ozone conc. in atm. (3 dimensions)
Some basic definitions • Random function: a type of regionalised variable which has both random and structured spatial characteristics • E.g. movement of people (moving home)
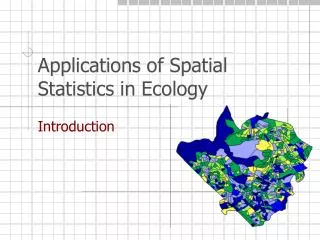
Types of spatial data • Geostatistical data: data from a random process where our variable (e.g. magnesium concentration) can be measured at any point (coordinate) over a fixed area or surface (for example a field)
Methods of spatial analysis • Linear interpolation: based on inverse-distance weighting • Does not account for variability in the data due to errors or assumptions Known Interpolated Known 20 10 0
Methods of spatial analysis • Kriging: method attempts to model the variability in the data as a function of distance, through a variogram • A variogram is a function which summarises the strength of association between responses as a function of distance, and possibly direction
Methods of spatial analysis • Not all variables are suitable for point to surface interpolation • Temperature • Rainfall • Drainage and hydrology • Population • Etc…
Methods of spatial analysis • We typically assume that the degree of spatial correlation does not depend on where a pair of observations is located, but rather the distance between the two observations • When estimating a surface from point values, kriging is a better approach than simple linear interpolation
Methods of spatial analysis • One powerful means of testing an assumed degree of pattern existence (clustering or scattering) is to use a quadrat analysis • We can select small sub-regions at random and sample the distribution of points within that test region • We compare the distance between points against a randomly distributed field pattern
Methods of spatial analysis • One of the best ways of examining point patterns is to produce a frequency distribution of counts (of the events or cases) within a particular quadrat area • Distances between points within the area and their frequency distribution can be used to objectively test for randomness, clustering or order
Methods of spatial analysis • The science of spatial analysis can be quite complex • Be aware not only of concepts of scale and distance - but also of geographic patterns • SS has MANY practical uses - e.g. How could you objectively test if incidences of cancer were anomalous around a nuclear power station?
Science Direct References • The geographic distribution of Parkinson's disease mortality in the United States,Journal of the Neurological Sciences, Volume 150, Issue 1, 1 September 1997, Pages 63-70 Douglas J. Lanska • Geostatistical and GIS analyses on soil organic carbon concentrations in grassland of southeastern Ireland from two different periods,Geoderma, In Press, Corrected Proof, Available online 24 September 2003, Chaosheng Zhang and David McGrath • Species diversity and spatial distribution of enchytraeid communities in forest soils: effects of habitat characteristics and heavy metal contamination,Applied Soil Ecology, Volume 23, Issue 3, July 2003, Pages 187-198 Pawe Kapusta, ukasz Sobczyk, Anna Ro en and January Weiner
Practical Today A2, B1, B2 2pm – 3:30pm A1, C1, C2 3:30pm – 5pm Please bring Coloured Pencils and Calculator