Download
1 / 12
120 likes | 229 Views
FY08 Exhibit 109 Materials +3.2% / $ 6.3 M Impact (Down $5.8M). 2009 Materials Usage Chart. Chart 2: 2009 P&L Impact. ^. *. * Total sales, GP and OP should agree to the delta in the POR vs. the Forecast at Fixed Rate

E N D
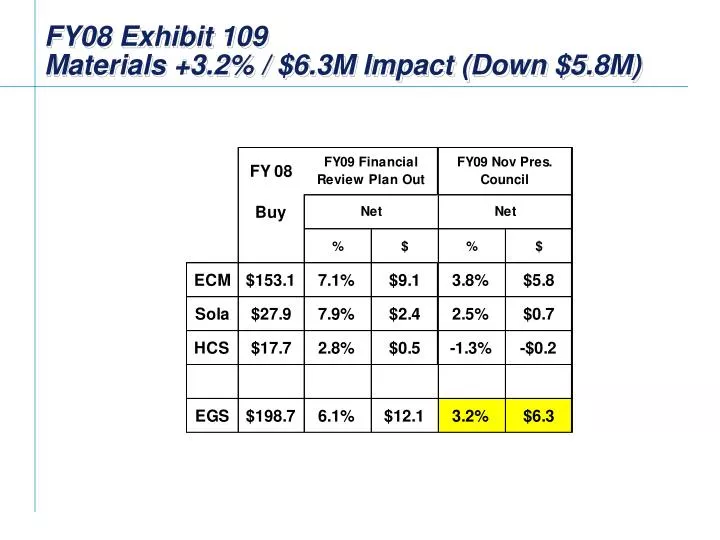
FY08 Exhibit 109 Materials +3.2% / $6.3M Impact (Down $5.8M)
Chart 2: 2009 P&L Impact ^ * * Total sales, GP and OP should agree to the delta in the POR vs. the Forecast at Fixed Rate ^ Note the total material delta for the year should agree with the delta on Chart 1
Supplier Risk – Top 400 analyzed IN PROCESS
EGS Supplier Consolidation Stampings 157 to 90 Wire, Cable 21 IN PROCESS Packaging 26 Fasteners 27 Electrical Parts 27 Goal: Reduce Total by 149 Suppliers
DPO Improvement Plan Graph needs cleanup
Non Ferrous Hedge PositionsAdjusting Band to Sync with Ability to Drive Price
Q1 FY09 Procurement Contribution Total Procurement Contribution is $XX.XM
BCCD/BCCS Alignment US W. Europe Asia HC Asia BC Latin America E. Europe ROW
eSourcing – Cost Containment PlanAcross all Spend Categories - $3.1M Planned for FY09