Download
1 / 1
20 likes | 183 Views
[m]. 4 000. 2 000. 0. convective depth:. MOC:. [ o C ]. time [years]. time [years]. 12. 18. 24. 30. 36. 0. 6. 1000. 1500. 2000. [ o C]. 0. 500. [ o C]. 1000. 1500. 2000. 0. 500. 18. 18. 1. 1. 15. 15. 2. 2. 12. depth [km]. 12. 3. 3. [m]. 9. [m]. 9. 12.

E N D
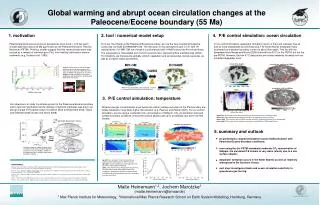
[m] 4000 2000 0 convective depth: MOC: [oC] time [years] time [years] 12 18 24 30 36 0 6 1000 1500 2000 [oC] 0 500 [oC] 1000 1500 2000 0 500 18 18 1 1 15 15 2 2 12 depth [km] 12 3 3 [m] 9 [m] 9 12 0 Atlantic 4 Pacific 4 6 1500 900 1200 0 300 600 6 3000 -6000 0 10 3000 temperature [oC] (for an ice-free ocean) 5 3 5 8 3 1 6 [oC] 1000 1500 2000 [oC] 0 500 1000 1500 2000 0 500 4 2 10 benthic δ18O [‰] 18 1 1 3 15 9 2 2 12 depth [km] 3 4 3 9 8 4 4 6 Arctic Ocean ‘Wedell’ Sea 5 5 5 3 7 30 60 50 20 40 0 10 Million years ago possible deepwater tracks 54.8 55.0 Millions of years ago 55.2 [Sv] 30 55.4 -1 1 0 -2 2 20 δ13C [0/00] 1 10 2 depth [km] 0 3 -10 4 -20 5 35 -30 40 90 30 60 -90 30 0 60 30 latitude [deg. North] 30 25 20 20 land surface temperature [oC] sea surface temperature [oC] 10 15 10 0 5 -10 0 0 -90 30 60 90 -90 30 60 90 60 30 60 30 latitude [deg. North] latitude [deg. North] Global warming and abrupt ocean circulation changes at the Paleocene/Eocene boundary (55 Ma) 1. motivation 2. tool / numerical model setup 4. P/E control simulation: ocean circulation Paleotemperature proxies show an exceptional, short-lived (∼100 ka) warm climate aberration about 55 Ma ago known as the Paleocene/Eocene Thermal Maximum (PETM). Previous studies suggest that this warm climate event was caused by a release of methane gas (CH4) from melting clathrates in marine sediments (e.g. Dickens et al. 1995). To study the climate at the Paleocene/Eocene boundary, we use the fully coupled atmosphere-ocean-sea ice GCM ECHAM5/MPI-OM. The resolution in the atmospheric part is T31 with 19 vertical levels. For MPI-OM, we choose a curvilinear grid with 144x87 points and 40 vertical levels. The topography is interpolated from a 2ox2o reconstruction derived by Bice and Marotzke (2002). For simplicity, we first assume globally uniform vegetation and soil properties (woody savanna), as well as constant orbital parameters. In our control simulation, deepwater formation occurs in the proto-Labrador Sea as well as more widespread around Antarctica. The North Atlantic deepwater flows southward as a western boundary current at about 2km depth. This fits with the deepwater track Nunes and Norris (2006) inferred from δ13C for the PETM, but not the pre-PETM. However, the few δ13C data points are located relatively far away from our modelled deepwater track. MPI-OM ECHAM5 circulation, surface to 690m: left: 65 million years of climate change: global deep-sea oxygen isotope ratio based on more than 40 DSDP and ODP sites; modified from Zachos et al. (2001); below: methane clathrate from ocean sediments and ‘burning ice’; pictures from www.rcom.marum.de. OASIS Model setup; bathymetry and orography as used to simulate the Paleocene/Eocene boundary. circulation, 690 to 2650m: 3. P/E control simulation: temperature Our objective is to study the climate system at the Paleocene/Eocene boundary and to test the hypothesis that the melting of methane clathrates was due to an abrupt change of the global ocean circulation (Bice and Marotzke 2002; Tripati and Elderfield 2005; Nunes and Norris 2006). Greenhouse gas concentrations even before the carbon isotope excursion at the P/E boundary are widely believed to have been higher than present (e.g. Pearson and Palmer 2000). For our control simulation, we are using a ‘moderate’ CO2 concentration of 560ppm. CO2 concentration and land surface boundary conditions (mostly the surface albedo) add up to an already very warm ice-free climate. upper left: 200a mean of the annual maximum of the monthly mean convective depth; lower left: global meridional overturning circulation (averaged over the last 200a); upper right: 200a mean of the top 690m average velocities; bathymetry plotted in the background; lower right: 200a mean of the velocities averaged over the 690m to 2650m depth layer. surface temperature: during PETM 5. summary and outlook before PETM we performed a coupled atmosphere-ocean GCM simulation with Paleocene/Eocene boundary conditions; Relative change in carbon isotope ratios of benthic foraminifera between different locations (colours) indicate a ‘switch’ of the deepwater flow; modified from Nunes and Norris (2006) even using the (for PETM standards) moderate CO2 concentration of 560ppm, the simulated P/E climate is very warm (mostly due to a low surface albedo); deepwater formation occurs in the North Atlantic as well as relatively widespread in the Southern Ocean; top left: time evolution of the horizontal mean potential water temperature in different areas; top right: surface temperature (averaged over the last 200a of the 2000a simulation); right: zonal mean surface temperature; black line is the 200a mean; upper and lower bound of the shading are given by the maximum and minimum monthly mean surface temperatures (also averaged over the last 200a). references: Dickens, G.R., J.R. O’Neil, D.K. Rea, and R.M. Owen,1995: Dissociation of oceanic methane hydrate as a cause of the carbon-isotope excursion at the end of the Paleocene, Paleoceanography, 10, 965-971. Bice, K.L. and J. Marotzke, 2002: Could changing ocean circulation have destabilized methane hydrate at the Paleocene/Eocene boundary? Paleoceanography,17, doi:10.1029/2001PA000678. Tripati, A. and H. Elderfield, 2005: Deep-sea temperature and circulation changes at the Paleocene-Eocene thermal maximum, Science, 308, 1894–1898. Nunes, F. and R.D. Norris, 2006: Abrupt reversal in ocean overturning during the Palaeocene/Eocene warm period, Nature, 439, 60–63. Pearson, P. N. and M.R. Palmer, 2000: Atmospheric carbon dioxide concentrations over the past 60 million years, Nature, 406, 695–699. next step: investigate climate and ocean circulation sensitivity to greenhouse gas forcing. Malte Heinemann1,2, Jochem Marotzke1 (malte.heinemann@zmaw.de) 1 Max Planck Institute for Meteorology, 2International Max Planck Research School on Earth System Modelling, Hamburg, Germany