Download
1 / 93
930 likes | 1.1k Views
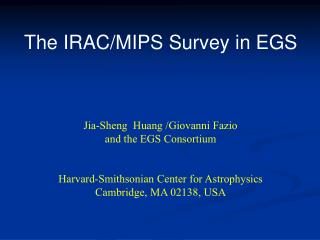
The IRAC/MIPS Survey in EGS. Jia-Sheng Huang /Giovanni Fazio and the EGS Consortium Harvard-Smithsonian Center for Astrophysics Cambridge, MA 02138, USA. Extended Groth Strip (EGS). Spitzer observation of EGS.

E N D
The IRAC/MIPS Survey in EGS Jia-Sheng Huang /Giovanni Fazio and the EGS Consortium Harvard-Smithsonian Center for Astrophysics Cambridge, MA 02138, USA
Spitzer observation of EGS • IRAC(3.6, 4.5, 5.8, 8.0um): Jan. 2004 (1.5h/p) , July 2004 (1.5h/p), total ~120h for all IRAC observation (3h/p). • MIPS(24, 70, and 160um): Jan. 2004 Spitzer safed, only 1/3 data were taken; June 2004, full depth data; total ~50-60h for MIPS observation. • Mosaic image: 3.6, 4.5, 5.8, 8.0, 24, 70um • Catalogs: 8um, 24um, 70um-selected samples.
Extended Groth Strip (EGS) 5’x5’ 3h IRAC 3.6 µm IRAC 8.0 µm
Q1700 deep field 5’x5’ 8h IRAC 3.6 µm IRAC 8.0 µm
NOISE AS A FUNCTION OF TIME(Q1700 FIELD) • Noise in Channels 1 and 2 deviates from root time at ~ 3000 sec (onset of source confusion noise). • Noise in Channel 3 and 4 is still decreasing as root time at 20,000 sec.
Mid-IR Properties of Normal Galaxies at z<1.5 • DEEP redshift sample (>10k galaxies with z) • B, R, I photometry • High resolution 2d-spectrum (Keck DEMOS) • z<1.4
MIR Spectroscopy with IRAC • Really?
UV-IR SED for Blue Galaxies 0.8<z<1.2 0<z<0.5
Morphologies of the 24um Source by J. Lotz et al • Using GINI-M50 Merger Classification to classify all 24um sources at z<1.2 • 50% Late type Spiral, 25% Early Type Spiral, 5% E/S0, 15% Mergers • 13 ULIRGS, half of them are mergers.
Radio Sources in EGS • VLA 6 cm covering the whole strip • 48 sources detected at f>0.5 mJy. 34 are single souces, the rest are either double or confused. • Out of 34, 28 are detected in the IRAC Bands, the remaining 6 have no IRAC counterparts.
Conclusion • IRAC colors can characterize galaxy spectra type (blue/red) at z<1.5 • IRAC colors is a good redshift indicator. • The 8 micron and 24 micron selected samples in EGS have significant number of galaxies at z>2 • The MIR band SEDs show that radio and SCUBA galaxies are either starburst or AGN at z>1 • The Chandra sources have a much wider IRAC color distribution than those just with power-law SEDs.