Download
1 / 10
100 likes | 121 Views
Explore key insights from the survey on hospitalist groups at HMS Hospitals, covering employment models, inpatient volume management, prophylaxis rates, and leadership roles. Detailed statistics and trends provided.

E N D
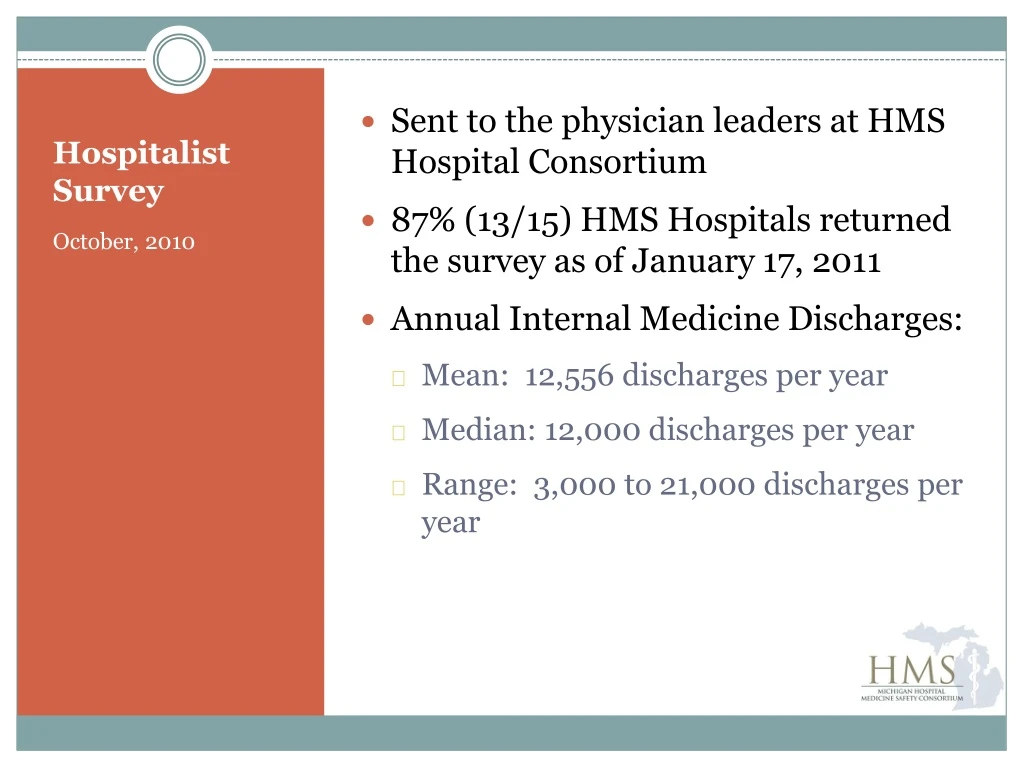
Sent to the physician leaders at HMS Hospital Consortium • 87% (13/15) HMS Hospitals returned the survey as of January 17, 2011 • Annual Internal Medicine Discharges: • Mean: 12,556 discharges per year • Median: 12,000 discharges per year • Range: 3,000 to 21,000 discharges per year Hospitalist Survey October, 2010
Hospitalist Survey: Hospital Description How would you describe your hospital? If academic, does your group care for Internal Medicine patients with or without residents?
Hospitalist Survey: Groups How many hospitalist groups work at your hospital? How many hospitalists are in your group? • Median 16 • Mean: 16 • Range: 2 - 37
Hospitalist Survey : Number How many hospitalists do you have at your hospital? • Median: 16 • Mean: 20 • Range: 3 to 55 Does your hospitalist group work at more than one hospital?
Hospitalist Survey: Financial Support Does your hospitalist group receive any financial support from the hospital?
Hospitalist Survey: Employment Model What is the employment model for your hospitalist group? • 46% of hospitalist groups are employed by a hospital or hospital managed corporation • 23% are employed by or contracted with a hospitalist management corporation • 15% are part of a multi-specialty medical group or IPA • 8% are part of a generalist medical group or generalist independent practice association • 9% are part of a University or Medical School
Hospitalist Survey: Inpatient Volume What percent of current Internal Medicine inpatient volume at your hospital is managed by your hospitalist group? • Median: 42% • Mean: 43% • Range: 15% to 80% If more than one group, what percent of current Internal Medicine inpatient volume is managed by hospitalists? • Median: 60% • Mean: 59% • Range: 21% to 90%
Hospitalist Survey: Prophylaxis Rates Who is responsible or owns improving VTE prophylaxis rates at your hospital? • 55% Hospitalists • 27% Hospital • 9% Nurses • 9 % Other (No plan in place at this time)
Hospitalist Survey: Characteristics 73% of hospitalist groups employ non-physician practitioners 100% reported at least some surgical inpatient volume is co-managed between hospitalists and surgeons. • 90% of hospitalist groups have a leadership role in Quality Improvement or Patient Safety Committee Membership: • Quality Council • Congestive Heart Failure • Pharmacy & Therapeutics • Office of Clinical Affairs Titles: • Associate Director of Quality • Vice President for Medical Affairs • Patient Safety Officer • Vice President of Safety/ Quality • Quality Improvement Chair • Medical Director • Faculty Group Practice Lead
Hospitalist Survey: Summary Hospitalists care for the majority of hospitalized medicine inpatients Most hospitalists are “employed” Most hospitalists believe they “own” VTE prophylaxis We have reached out to the right group!