Download
1 / 28
280 likes | 290 Views
This scientific report explores the understanding of climate change, including common misconceptions and observed changes. It also highlights the increasing greenhouse gases and their impact on global temperatures and sea level rise.

E N D
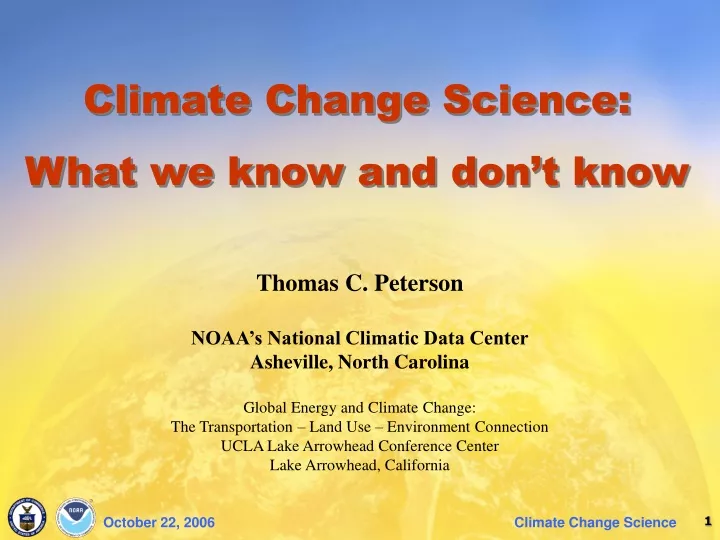
Climate Change Science: What we know and don’t know Thomas C. Peterson NOAA’s National Climatic Data Center Asheville, North Carolina Global Energy and Climate Change: The Transportation – Land Use – Environment Connection UCLA Lake Arrowhead Conference Center Lake Arrowhead, California
PHYSICAL PROCESS 2) How well do we understand the climate system ? • Outline • Defining the Climate Change Issue • Common misperceptions • Understanding observed changes • Changes & projections “In the News” • Heavy Precipitation • U.S. Tropical storms • Drought • General conclusions • Climate change and transportation
A SCIENTIFIC STATUS REPORT: There is a natural greenhouse effect. It keeps the Earth warmer than it would be otherwise. 10 5 0 • Points . . . • In terms of basic physics: “Confidence Index” (A) If an object is bathed in visible light . . . (B) It warms up and . . . • In terms of planet Earth: (C) It emits infrared . . . LIGHT ! Atmosphere Abundance Nitrogen . . . . . . . . . . . . . . 78% Oxygen . . . . . . . . . . . . . . . 20% Water Vapor . . . . . . . . . . 2% Carbon Dioxide . . . . . . 0.04% } Greenhouse Gases
A SCIENTIFIC STATUS REPORT: There is a natural greenhouse effect. It keeps the Earth warmer than it would be otherwise. (Cont’d.) 10 5 0 • Key Aspects . . . • Water Vapor & Carbon Dioxide have been part of our atmosphere for millions of years. “Confidence Index” • Their presence yields an average surface temperature of ~ 60oF. ? • Without them, the average would be ~ 5oF. Q: So . . . What’s the problem?
GREENHOUSE GASES ARE INCREASING IN THE ATMOSPHERE BECAUSE OF HUMAN ACTIVITIES, & THEY ARE INCREASINGLY TRAPPING MORE HEAT. 10 5 • Points . . . • Impeccable scientific measurements 0 “Confidence Index” • Other gases have increased too. • For Example: • Methane (1/3 the effect • of CO2) • Sulfur (a cooling tendency) AIR SAMPLES ICE CORES • The increases are human-caused. • CO2 - Combustion • Methane - Agriculture 36% increase over the industrial era
Climate Forcing Summary From Ravishankara (2006)
Common Misperceptions • Last winter was cold & snowy in Europe & Asia - so much for global warming! • Actually - - - last winter was much warmer than average • across the USA • Probability of Northern Hemisphere cold winters are decreasing (e.g., last 12 winters above average) • Satellites show global cooling not warming! • Thought to be true several years ago • Now - - - more data and improved analyses • reveal significant warming at the surface and • in the troposphere • Heat islands lead to over-exaggerated claims of observed warming! • Strong warming over oceans (unaffected by • heat islands), snow and ice extent decreasing • Heat island effect examined and addressed • in the temperature records • Lake and river ice extent decreasing • Paleo data reveal warming (bore holes, tree rings, ice cores, etc.)
Common Misperceptions (cont’d.) • Solar variations are responsible for any global warming! • Best evidence today suggests warming in first part of the • 20th century influenced by solar radiation • Since satellite measurements (late 1970s) no appreciable • changes in total solar output - - at time of rapid global temperature increases • Global warming will be negligible due to the planet’s self regulating thermostat (the “iris effect”)! • Redistribution of tropical clouds were hypothesized to allow more heat to escape into space as globe gets warmer • BUT - - Observational data (in-situ and satellite) show the opposite
THERE IS A COLLECTIVE PICTURE OF A WARMING WORLD, & HUMAN ACTIVITIES HAVE LIKELY CONTRIBUTED 10 5 • Points . . . • Global temperatures: Up 0.7 – 1.4o F over past 100 years 0 “Confidence Index” • Consistent with the warming: • Glacial retreat • 10-15% reduction in Arctic sea ice extent (1970s) • Snow-cover decrease (10% since 1970s) • Freeze-free periods lengthened (20th century) • Sea-level increased 4-8 inches (since 19th century) • Lake and river ice shortened season (~ 2 weeks, 19th to 20th century)
MOST OF THE WARMING OVER THE PAST 50 YEARS IS LIKELY TO BE DUE TO GREENHOUSE GAS INCREASES. 10 5 0 “Confidence Index” • Reasons . . . • Comparisons of simulated • vs. observed temperatures: • Simulations with natural and human factors match observations best • Correspondences increase with time • Probability is low that a “natural only” Earth would have such correspondences. ? Q: What could this mean for the future?
A CONTINUED GROWTH IN GREENHOUSE GASES IS PROJECTED TO LEAD TO VERY SIGNIFICANT INCREASES IN GLOBAL TEMPERATURES & SEA LEVEL. 10 5 0 • Points . . . • CO2 abundance will likely double by 2100. • Indeed . . . To stabilize at doubled cuts in emissions “Confidence Index” • Predicted climate responses • For a range of future emission scenarios (Non-intervention, economics, technology, population) • Global temperature rise of 2.5 to 10oF • by 2100 • If so, this would exceed the natural • changes over the past 10,000 years • Corresponding sea level rise of 4 to 35 inches by 2100
Observed changes & projections “in the News”- Heavy Precipitation - Tropical storms - Drought Hurricane Katrina Forecast Track Overlay Western U.S. Drought
Observed changes and projectionsHeavy Precipitation Facts from Climate Models and Theory 10 • Increasing levels of greenhouse gases warm the climate and lead to increases in very heavy precipitation events 5 0 “Confidence Index” 10 Why: Increasing air temperatures result in a greater amounts of water vapor in the air 5 0 “Confidence Index”
Observed changes and projectionsHeavy Precipitation Facts from Observations Contributes to Annual TotalHeavy Precip Days (>95th percentile • Observed 3% increase in extreme precipitation frequency over last 50 years; middle & high latitudes (IPCC) • Warmer climates get more rainfall in extreme events compared to colder climates 10 • Precipitable water (atmospheric water vapor) has increased ~ 0.5 mm per decade (~ 0.2 inches per century) latter half 20th century. 5 Alexander et al. (2005) 0 “Confidence Index”
Observed changes and projectionsTropical Storms What factors influence seasonal to multi-decadal hurricane activity? • Hurricanes respond to many environmental factors in addition to ocean temperatures. • Tropical multi-decadal phenomena and the El Niño/La Niña cycle are important factors • Research: global warming leads to increased hurricane intensity; less evidence for frequency 10 5 Confidence Index 0 10 5 Confidence Index 0 Atlantic hurricane activity during the 20th Century • Since 1995, significantly more hurricanes and more intense that the previous two decades • Past decade: increased US landfalls; higher landfalls frequency occurred in early century 10 5 Confidence Index 0
Observed changes and projectionsTropical Storms How have ocean temperatures varied? • Over the 20th Century, global ocean temperatures have warmed and… • Tropical Atlantic temperatures significantly warmer than the global average • Part of this warming may be relatedto the Atlantic Multi-decadal Oscillation (AMO) How long will the current active period last? • Varying Viewpoints. Increase in hurricane intensity and frequency attributed to: • Natural Variability alone (cycles)…….. • Natural Variability and Global Warming…………… 10 5 10 Confidence Index 0 5 Confidence Index 0
Observed changes and projectionsDrought Observations Drought activity during the 20th and early 21st Century • Drought is a recurrent part of the U.S. climate. • Widespread drought can affect the country for years (e.g., 1930s “Dust Bowl”) • U.S. droughts show pronounced multi-year to multi-decadal variability, but no convincing evidence for long-term trends toward more or fewer events. 10 5 Confidence Index 0
Observed changes and projectionsDrought Observations Drought as documented in the paleoclimatic record? • Within the past millennium there have been severe droughts in both the western U.S. and Midwest that have lasted for multiple decades (50 years). • As temperatures increase, it may lead to more intense droughts during periods of dry weather due to increases in evaporation. • Models suggest that as the planet warms, storminess and the jet stream tracks will shift northward; may lead to drier conditions in S and SW U.S. 10 5 Confidence Index 0 What about the Future? 10 5 Confidence Index 0 10 5 Confidence Index 0
IT IS A COMPLEX PLANET & WE HAVE IMPERFECT KNOWLEDGE, SO, SURPRISES LIKELY • Surprises? • Currently unknown geophysical processes activated? • Methane releases as permafrost melts • Ocean circulation changes • Melting Ice Sheets Possible!Here’s why: We are entering a new regime of climate perturbation. Climate is a non- linear system. } • Is there a safe level of greenhouse gas concentrations? • Value judgment . . . • On our way to concentrations larger than observed over past 500,000 years or more
GENERAL CONCLUDING COMMENTS • Bottom linesTheVAST MAJORITYof thescientific viewpoint: • Human-caused global climate change has occurred. • Exactly - where (regions) - when (rate of change) - how much (magnitude) } } Many details hard to predict Some aspects have more confidence than others
Now a few details from our new paper “Climate Variability and Change with Implications for Transportation” • Commissioned by the National Research Council. • Just submitted last month. • Transportation is particularly sensitive to changes in extremes. • Used historical observations and model projections that contributed to the IPCC Fourth Assessment Report.
Year To the range of projected changes into perspective, the mean annual temperature in Los Angeles is ~ 3.5 degrees C (or Kelvins) warmer than San Francisco.
Precipitation Projections Year To put the range of projected changes into perspective, the annual precipitation in San Francisco is ~ 18 cm greater than Los Angeles
Climate Change and Transportation Conclusions • Climate change will definitely impact transportation. • Some impacts will be negative. • E.g., increased potential for rail track buckling. • Some impacts will be positive. • E.g., likely opening of the Northwest Passage. • In all cases, planning that considers climate change will be important.